Advisor Perspectives welcomes guest contributions. The views presented here do not necessarily represent those of Advisor Perspectives

Jeremy Grantham, the chairman of GMO and one of the most respected investment minds of our era, believes strongly in what he describes as market “inefficiencies” within the “Presidential Cycle.” He is referring to the fact that stock market returns are not distributed randomly across the four-year presidential election cycle, but rather are strongly skewed to favor the pre-election year. Grantham believes – and I agree – that the evidence is incontrovertible: the behavior of the political class over the election cycle systematically and profoundly effects the distribution of stock market returns.
Naturally such a conclusion is anathema to investment advisors who believe that market returns are random and that holding stocks continuously is the only way to harvest the superior long-term returns the market has to offer.
Yet, if Grantham is correct, it should be possible to develop a disciplined investment management strategy to exploit the inefficiencies within the election cycle. Such a strategy could deliver high, risk-adjusted returns over the long term.
Let’s take a look at the election cycle and see if we can’t construct such a strategy.
The political “Sweet Spot”
Consider this fact: Since 1933, the Dow Jones Industrial Average (with dividends) has been up during every pre-election year (year three of the presidential term). The average return has been 17.1 percent plus dividends, about three times the average return of the other three years. Every bear market (with the exception of the 1987 collapse) has occurred outside the pre-election year over this 78-year period.
I believe the cause of this remarkable market inefficiency is the predictable and rational response of the political class to mid-term Congressional elections. The mid-term elections mark a turning point in the halls of Congress and in the White House. Politicians, who devoted the first half of the presidential term to grand schemes for social change, must now prepare for the next presidential election. This means a change in behavior. All of a sudden, big spenders become fiscally conservative. All talk of raising taxes is shelved. Every incumbent pledges to cut the deficit and balance the budget. Politicians promote business-friendly legislation. In some cases, the Federal Reserve joins the party by juicing the economy with easy money and lower rates. The Fed, like other Washington insiders, does not want to be blamed for a poor economy at election time.
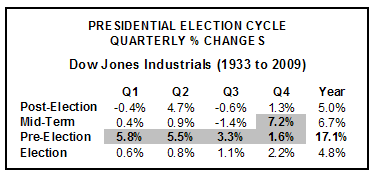
Looking at the distribution of returns on a quarterly basis shows how powerful this effect is. Note that the best quarter in the election cycle is the fourth quarter of the mid-term year – the quarter containing the mid-term elections. This quarter, coupled with the four quarters of the pre-election year constitutes the market’s political “sweet spot.”
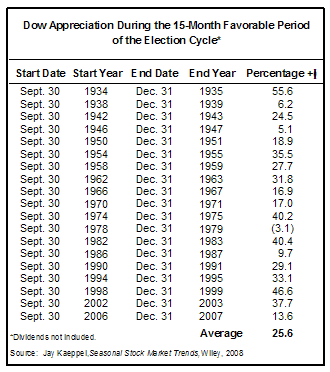
The following chart details the performance of the Dow during every sweet spot since 1933.
Over this period, the average gain during the five-quarter sweet spot has been 25.6 percent, representing an annualized return of 19.9 percent (without dividends). The average daily gain during the sweet spot was 7.65 times greater than the average daily gain during all other trading days. A $1,000 investment in the Dow grew to $66,120 during the sweet spot, even without interest earned in the intervening months. A $1,000 investment in the Dow during all other months grew to just $1,383 (as of December 31, 2008).
Exploiting the “Sweet Spot”
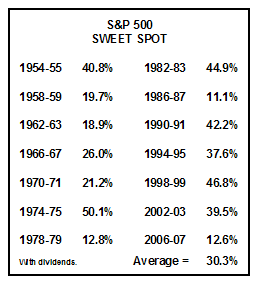
As a first step for constructing our investment strategy, let’s take a look at the S&P 500’s sweet spot over the past 50 years.
$1,000 invested in the S&P 500 sequentially during sweet spot periods would have grown to $42,912 over 17.5 years.
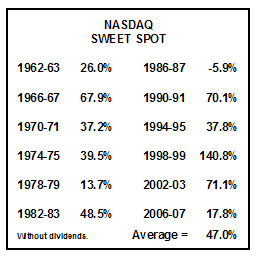
This remarkable performance raises an interesting question. If the 15-month political sweet spot is good for blue-chip stocks, what does it mean for the over-the-counter universe? Here are the sweet spot results for NASDAQ since its inception in 1961.
$1,000 invested sequentially in these periods would have grown to $73,187 over 15 years. It’s pretty clear that the riskier elements of the stock market also react very favorably to the sweet spot.
Building the strategy
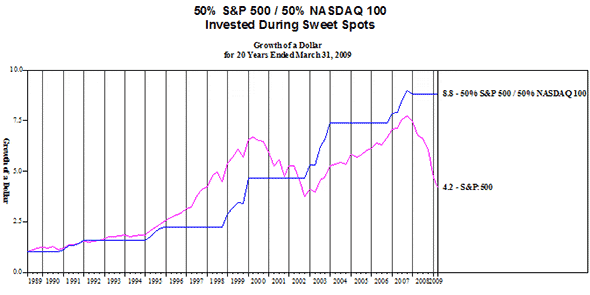
We now have enough information to construct a very simple and powerful investment strategy based on the election cycle. Our strategy is to invest in the stock market during every 15-month sweet spot using a portfolio split evenly between the S&P 500 and the NASDAQ 100. Our portfolio, then, is dominated by large cap stocks with a strong tilt to growth companies and technology. The result of this strategy over the past 20 years looks like this:
One dollar invested in the five sweet spots since 1989 grew to $8.80, without earning interest in the intervening periods. The same dollar, invested continuously in the S&P 500, with dividends, grew to $4.20. The average sweet spot return over this period was 57 percent.
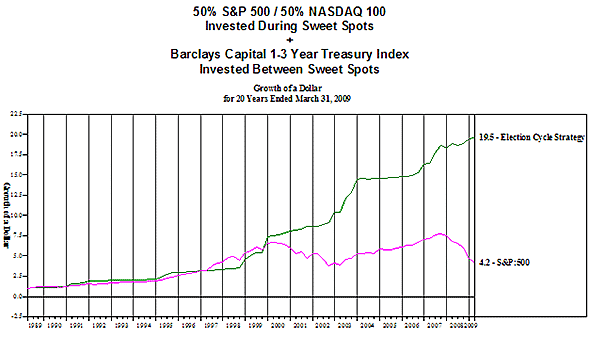
Next, let’s fill in the gaps between sweet spots with a very conservative fixed-income investment. We’ll use the Barclay’s Capital 1-3 Year Treasury Index as our simulation. We now have our “Election Cycle Strategy”.
The final outcome for the past twenty years is nothing short of amazing. Invested just 30 percent of the time in equities, our simple election cycle strategy produced a twenty-year average return of 16.1 percent, with no down years. The S&P 500, over the same period, returned 7.43 percent with dividends. An investor following this strategy would be breezing through the current bear market holding safe short-term government bonds until October 1, 2010.
Conclusion
If there is one lesson every investor should have learned by now, it is that large losses destroy investment programs. Not only must an investment portfolio that suffers a large loss contend with the asymmetry of gains and losses (a 50 percent loss requires a 100 percent gain to recoup), but the time to recover is totally unpredictable. Too many investors are simply unaware of the historical precedents for this dilemma.
An investment started in 1965 in the S&P 500 didn’t begin to make gains until 1989, adjusted for inflation. A diversified portfolio of stocks during that extended period, which contained several large market corrections, destroyed purchasing power for 17 years before the market recovery began in earnest in 1983.
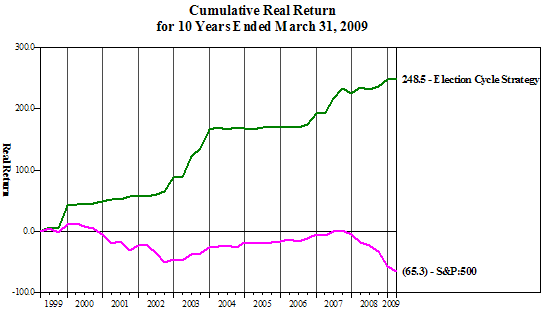
We are facing the same dilemma today. Over the past decade, the stock market has destroyed capital and reduced purchasing power at an alarming rate. For the ten-year period ending March 31, 2009, the total return of the S&P 500 was -26.3 percent. In real, inflation-adjusted terms, the total return was -65.3 percent, a real loss of 6.35 percent per year. To recover this loss will require about a 200 percent real increase. I have no doubt that the recovery period will exceed ten years, which means at least a 20-year dead zone for the market. Pity the poor indexer who staked it all on the market in the late-90s.
If the past decade has taught us anything, it is that the doctrine of being continuously invested in the market is bankrupt. Any investment strategy that results in a 65 percent real loss over a decade cannot be a sound choice for serious investors. It certainly cannot be a strategy for retirees who are drawing down their savings constantly.
Our simple election cycle strategy is a good alternative to the conventional buy and hope doctrine. By accepting market risk only during the political sweet spot, we put the entire political establishment on our side. This is a powerful form of portfolio insurance. It shows up in the real-return comparisons for the past decade.
To trust that this strategy will continue its winning ways, we simply have to believe that politicians will continue to “transform” into business-friendly, inflation-fighting, deficit-reducing, anti-tax paragons of fiscal sobriety in preparation for the presidential election. For my money, that’s a pretty good bet.
*Arthur “Jerry” Minton is the president of Alpha Investment Management located in Cincinnati, Ohio. Alpha specializes in risk management using seasonal strategies. Jerry received his Ph.D. in philosophy from the University of Cincinnati. He welcomes email inquiries at:
. Extensive data on the election cycle is available at www.alphaim.net.
Read more articles by Jerry Minton

 The final outcome for the past twenty years is nothing short of amazing. Invested just 30 percent of the time in equities, our simple election cycle strategy produced a twenty-year average return of 16.1 percent, with no down years. The S&P 500, over the same period, returned 7.43 percent with dividends. An investor following this strategy would be breezing through the current bear market holding safe short-term government bonds until October 1, 2010.