Several prominent analysts have written recently that the bear market in housing is nearing its end. Writing with varying degrees of conviction and citing a range of statistical measures, they reach the broad conclusion that now is the time to buy a house.
What follows is a summary of those opinions – from James Grant of Grant’s Interest Rate Observer, Dave Leonhardt of The New York Times, and Anatole Kaletsky of GaveKal Research. To those voices we could add Karl Case, the co-creator, along with Yale professor Robert Shiller, of the Case-Shiller Housing Index, who two weeks ago said that it was the best time to buy a house “in the last four, five years, and maybe in my lifetime.”
My view, though, is considerably different and far more pessimistic. As I will explain, I am not alone in forecasting that residential housing prices will continue to deteriorate, perhaps significantly, at least over the short term.
The bull case for housing
In the July 9 issue of his publication, James Grant reviewed three metrics supporting his claim that “house prices are cheap, very cheap, or fairly valued, respectively, according to the valuation method employed.” Grant’s first metric was the calculated transaction value (CTV) – the average house price times the number of houses sold, divided by the GDP. Essentially, it represents housing’s share of the GDP. At the time of his writing, the CTV was 8.7%, compared with an average of 9.8% since 1970. Housing, by implication, should revert to its mean relative to GDP, and house prices should rise.
Grant went on to say that housing is now highly affordable by historical standards, citing the National Association of Realtors index. That index, which measures the ratio of median income to median housing costs, stands at 174.8, while its long-term average is 127. More people can afford houses, and that too should drive up prices.
Third, Grant cited 50 years of data on the ratio of rental income to housing prices, which, currently at 5%, is nearing its historical average. That ratio had descended to approximately 3% in early 2006, at the peak of the housing bubble. Relative to renting, the decision to buy a house is now an even tradeoff.
Grant added, however, that his view is tempered by the uncertainty of additional housing that might come on the market through the foreclosure process. Grant noted that “as many as seven million mortgagors are delinquent or in foreclosure and will eventually be liquidated.” I will return to that point later.
In his September 7 article, The Bears and the State of Housing, Dave Leonhardt wrote that homebuyers planning to stay in their homes longer than a few years “should take some comfort in the fact that the bubble seems mostly deflated. Sometime soon, prices should begin rising again.”
Leonhardt based his view on the argument that housing is more a luxury good than a necessity and, as such, prices should track income over time. He cited data from Yale’s Shiller to show that housing costs, as a percentage of income, have hovered around 14% to 15% for the last 60 years. Most of that growth, Leonhardt argues, was driven by increases in the prices of the land on which the houses were built.
Prices are now back in line with incomes, Leonhardt wrote. The ratio of median house price to income is approximately 3.4, as compared to an average of 3.2 prior to the onset of the housing bubble in 1970, and therefore housing prices should stabilize.
If, however, you view housing as more of a necessity, then Leonhardt conceded that housing could still be overvalued by as much as 30%. That view points to housing prices that track inflation over time, much as do food prices, and implies that housing was in a multi-decade bubble over the last 40 years. The Case-Shiller index would need to decline another 30% to be in line with its pre-1970 average.
The third leg of the bullish argument comes from Anatole Kaletsky, who wrote in his September 9 commentary that “a further significant decline in US house prices seems to us highly improbable for reasons of both demand and supply.”
For the last 50 years, Kaletsky said, there has been demand for approximately 1.6 million new units each year. Three-quarters of that demand arises from population growth, and the other quarter comes from homes destroyed by fire and decay. That’s roughly equal to the 1.51 million homes built annually over that period. Lately, however, housing starts have slowed to a mere 588,000 per year.
Supply is consistent with pre-bubble levels, according to Kaletsky. He said that the 18.9 million units of housing that are currently considered unused are not much more than the 16.6 million units similarly classified in 2006. He argued that the millions of homes in foreclosure should not be lumped into excess supply, since their occupants will ultimately need some form of housing.
Demand should be strong, according to Kaletsky, driven by incomes (as Leonhardt argued), low interest rates, and prices, which together are “as favorable as they have ever been.” Kaletsky did note, however, that bearish housing market sentiment and tighter mortgage credit standards would counteract demand growth.
What really matters though is …
Housing prices, like any other commodity in an economy, are governed by supply and demand. What matters is not whether housing costs take up a smaller slice of the economy, or what buying a house costs relative to renting, or housing’s cost relative to inflation, or even its affordability.
Prices, in any given market, are driven by the number of units on the market relative to the number of buyers.
On that score, the news is dim. John Burns, who runs a California-based real estate consulting service, made this point in a commentary published last week:
"Prices will decline, potentially significantly. Prices will decline because there is more than a one-year supply of homes on the market, and several bank servicing arms and REO managers [those who manage properties in foreclosure] have told us that they will drop price to get the loans and homes off their books. Only a quick economic recovery, or a government mandate to rent the homes out, can prevent further price declines."
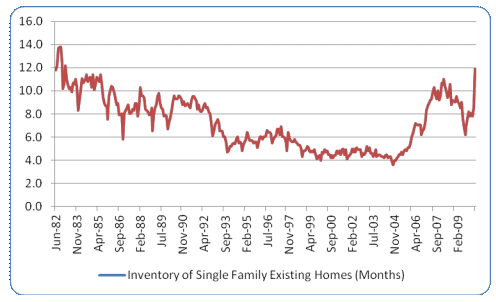
Burns’ view is supported by the National Association of Realtors (NAR), which provides the data series that offers the best insights into the relationship between housing supply and demand – the “inventory” of unsold existing homes:

The most recent data, as of July, showed that there were 3.35 million single-family existing homes on the market, representing 11.9 months of inventory, versus an average of 7.2 months since mid-1982, when the NAR began collecting data. Looking more broadly at all existing homes, there were 12.5 months of inventory available as of July, nearly twice the historical average of 6.2 months since the data series began in 1999.
Demand has not been spurred by record low mortgage rates. Buyers are not in the market. The Mortgage Banking Association’s index of applications has not surged, despite low rates and the now-expired home buyer incentives.
The greater concern, though, comes from the seven million homes Grant cited as being in the foreclosure process. Those homes, which Burns and others refer to as the “shadow” inventory, represent nearly twice the volume of existing homes currently on the market. Even if new home construction ceased entirely (and it’s already pretty depressed), it will take years before existing inventory is reduced to historically average levels – absent significant price reductions.
Burns is at least partially right, in that a quick economic recovery could stabilize prices, but only to the extent that unemployment falls as a result. A jobless recovery will not stem housing price declines. Anyone without a job or fearful of losing their job will not be in the market to buy a home and, more likely, may contribute to the inventory of unsold homes, either through foreclosure or through a decision, as do many young people, to move in with their parents.
If you’re in the market for a home, be patient. Prices are likely to come down even further, depending on the conditions in your local market. Don’t extend this analysis to the broader economy, though, as the likelihood of a double-dip recession or a booming recovery may be independent of movements in housing prices. With the growing disconnect between the economy and movement in the markets, this analysis says almost nothing about whether equities are headed up or down.
Read more articles by Robert Huebscher