If you are unwilling or unable to forecast rate movements, then delegating fixed-income management – through an “unconstrained” bond fund – offers the hope of strong performance regardless of market environments. But the data show that over the last three years, unconstrained funds on average did not meet that goal.
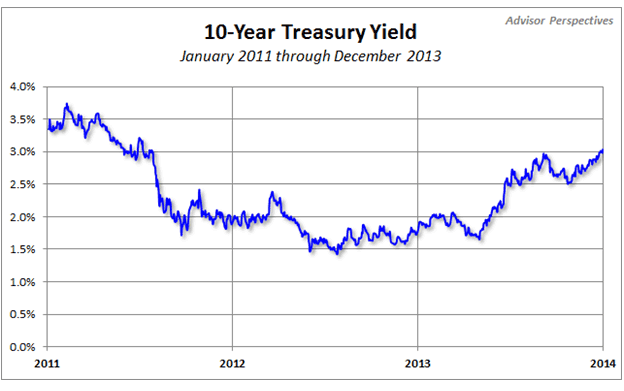
The last three years were a good test laboratory for unconstrained funds. The 10-year rate was 3.36% on Jan. 1, 2011, and 3.04% on Dec. 31 of last year. With rates bottoming out in July 2012, the last three years saw roughly equal periods of falling and rising rates:

Using data provided by Morningstar, I compared the performance of unconstrained bond funds to intermediate- and long-term bond funds over this period. The data I used is provided in the appendix (PDF version only) and I will make a spreadsheet available upon request. I examined only funds that were in existence for all three years. I did not attempt to correct for survivorship or backfill biases.
I investigated the following questions:
- Did unconstrained bond funds outperform the other categories of funds on an absolute or risk-adjusted basis?
- Did low correlation to the bond market result in higher fund performance?
- Which bond-fund characteristic was a greater contributor to increased return: low correlation to the bond market or a low expense ratio?
The answers to those questions are provided below.
The results of the study
Below are the summary statistics from the study:
|
Number of Funds
|
Total Ret Annlzd 3 Yr (Mo-End)
|
Std Dev 3Yr (Mo-End) Risk Currency
|
Correlation to Barclays US Agg, 1/1/2011-12/13/2013
|
Correlation to BofAML US Treasury Current 10-Yea,r 1/1/2011=12/13/2013
|
Annual Report Net Expense Ratio
|
Sharpe Ratio
|
|
Unconstrained
|
32
|
2.72
|
3.83
|
0.16
|
-0.12
|
1.20
|
0.84
|
|
Intermediate term
|
237
|
3.86
|
2.95
|
0.83
|
0.60
|
0.70
|
1.31
|
|
Long term
|
11
|
5.83
|
5.98
|
0.85
|
0.77
|
0.85
|
1.00
|
|
AGG
|
1
|
3.26
|
2.75
|
1.00
|
0.89
|
0.08
|
1.17
|
|
10-year Treasury
|
1
|
2.79
|
|
Average Correlation to AGG
|
Average Correlation to 10-year TSY
|
Correlation Between Return and Expense Ratio
|
Correlation Between Return and Correlation to AGG
|
Correlation Between Return and Correlation to 10-year TSY
|
|
Unconstrained
|
0.16
|
-0.12
|
-0.28
|
0.10
|
-0.15
|
|
Intermediate term
|
0.83
|
0.60
|
-0.27
|
-0.38
|
-0.45
|
|
Long term
|
0.85
|
0.77
|
-0.12
|
-0.12
|
0.21
|
A number of findings emerged:
- Unconstrained bond fund performance, on average, has been disappointing over the last three years. Returns (2.72%) were lower on average than intermediate-term (3.86%) and long-term (5.83%) funds and the AGG (3.26%). They were also lower than the risk-free return on the 10-year Treasury, which was 2.79%.
- There were only 32 unconstrained funds with three years of data, so the sample size is small. Another 43 unconstrained funds have been launched in those three years, for which complete data are not available. There were even fewer (11) long-term funds, so those data are even more suspect.
- The volatility of unconstrained bond funds (3.83) was higher than intermediate funds (2.95) but lower than long-term funds (5.98) funds. The volatility of the AGG was 2.75.
- The Sharpe ratio for unconstrained funds (0.84) was lower than for the other categories (1.31, 1.00 and 1.17, respectively).
- Unconstrained funds had lower correlations to the AGG (0.16) and the 10-year TSY (-0.12) than to intermediate funds (0.83 and 0.60, respectively) and long-term funds (0.85 and 0.77, respectively). But the lower correlations did not translate to higher performance, either on an absolute or risk-adjusted basis.
- Although unconstrained funds had the lowest correlations of the three fund categories, low correlation did not necessarily translate to higher returns. Among unconstrained funds, the correlation between returns and the correlation to the AGG was 0.10. The correlation between returns and the correlation to the TSY was -0.15.
- For intermediate-term funds, lower correlations had a stronger correlation to higher returns. The correlation between returns and the correlation to the AGG was -0.38. The correlation between returns and the correlation to the TSY was -0.45.
- In all cases, lower expense ratios improved returns – all correlations of expense ratios to returns were negative. This partly explains the poorer performance of unconstrained funds, which had higher expense ratios than intermediate- or long-term funds.
- For unconstrained funds, expense ratios had a greater impact on returns than correlation to the bond market. There was a greater negative correlation to expense ratios (-0.28) than to the AGG (0.10) or the TSY (-0.15). For intermediate-term funds, this was not true, as the negative correlation to expense ratio (-0.27) was less than to the AGG (-0.38) or the TSY (-0.45). For long-term funds, there was a negative correlation to expense ratio (-0.12) which was the same as the correlation to the AGG, but that was less than the correlation to the TSY (0.21).
Unconstrained funds are an unproven asset sub-class, at least based on the way Morningstar classifies them. (Morningstar uses holdings-based analysis to determine the proper category for a fund as well as input from its fund analysts.) The data available for funds with three years of history offer no compelling evidence that they are superior to funds in the other two classifications.
Being uncorrelated, however, did help performance for intermediate-term funds, which had stronger risk-adjusted performance (Sharpe ratio) than unconstrained funds. But a low expense ratio matters as much as being uncorrelated.
These results offer no insights as to which individual funds are likely to outperform on an ongoing basis. But for advisors who seek an active bond manager who will deliver strong performance in a variety of interest-rate environments, limiting the universe of candidates to those funds that are unconstrained is unwise. Advisors should look for funds in all three categories – and possibly other categories not considered here, such as long/short funds. Lower correlation has helped performance, but the most reliable way to improve returns is through lower expense ratios.
Read more articles by Robert Huebscher