Are Returns of Intermediate Bond Funds Persistent?
Membership required
Membership is now required to use this feature. To learn more:
View Membership BenefitsIn the search for skillful managers, the most valued characteristic is persistence – the ability of a manager to achieve superior returns consistently over time. Finding such managers is critical for fixed-income allocations, since the theoretical basis for indexing is weaker than it is for equities. Our study found, however, that persistence is elusive among a large sample of taxable bond funds.
A preliminary analysis of intermediate-term bond fund returns from 2004 to 2013 shows how difficult it can be to confidently assign causes to investment performance. From different quantitative analytical perspectives, the differences in intermediate-term bond fund performance could be due to persistent managerial skill, underrating of bonds by ratings agencies, cyclical changes in sentiments or data and statistical noise.
Advisor Perspectives obtained year-by-year investment return and standard deviation data from Morningstar Inc. for the years 2004-13 for 280 U.S. intermediate-term bond mutual funds. The aim was to investigate whether manager performance was persistent from year to year over this period.
From a preliminary study of the data, I was only able to come to one of the four tentative conclusions listed above. Further study would be required to choose from those conclusions, and even then it may be very difficult.
First look: apparent persistence of managerial performance
I initially limited the study to those funds for which there were 10 full years of data. This reduced the number of funds under consideration to 200. I subsequently reduced that number to those funds for which Morningstar could provide an average Standard & Poors quality rating for at least one of the 10 years. The reason for this will be explained shortly.
For those 200 funds for which there were 10 years of returns and standard deviations, I calculated annual Sharpe ratios by subtracting each year’s 3-month Treasury-bill return from each fund’s rate of return for that year and dividing by the corresponding year’s standard deviation, as measured by Morningstar.
A standard statistical test for a trend – a positive correlation of one year’s data with that of the next year – is to calculate the serial correlation coefficient, also known as the autocorrelation.
When the serial correlation for raw annual rates of return was calculated for each the 200 funds, it averaged approximately zero. However, the serial correlation for excess returns – in excess of the 3-month T-bill return – averaged an almost-significant 0.19. The serial correlations for the Sharpe ratio, moreover, averaged 0.28. This serial correlation was positive for more than 90% of the funds.
This suggests a persistent skill factor enabling outperformers to outperform year after year (in a statistical sense — that is, more often than not), while underperformers, more often than not, underperform year after year.
However, I was worried that there may be some additional factor causing consistently superior performance for some types of funds and consistently inferior performance for other types of funds. For example, it is well known that funds with higher risk will tend, more often than not, to outperform funds with lower risk over time. The Sharpe ratio is supposed to correct for that effect by dividing by a surrogate for risk: standard deviation.
It is also well known that standard deviation can be an imperfect measure of risk. Hence, I searched for another factor that may provide either a consistent boost or a consistent depressant to performance.
The impact of bond quality
That factor could be the average quality of the bonds in the mutual fund. Therefore, Advisor Perspectives requested each fund’s average quality rating from Morningstar.
That information was available for at least one of the 10 years for 189 of the 200 funds previously identified. The average quality of the bonds in the portfolio was estimated to be the 10-year average of the average quality ratings provided by Morningstar. Only those years for which an average rating was available were included in the 10-year averaging process. Numerical equivalents for the S&P quality ratings, which were in the form of letter ratings such as AAA, AA, A, BBB, etc., were used for the averaging and were obtained from this site.
When those average quality ratings were considered, I found that Sharpe ratios were higher for funds with lower average quality ratings. The correlation coefficient between the Sharpe ratios and the average qualities was -0.29.
The effect was more starkly evident when the 189 funds were divided into their quality-ranking deciles. The results are shown in Table 1.
Table 1. Average intermediate-bond fund quality and Sharpe ratio by decile, 2004-2013
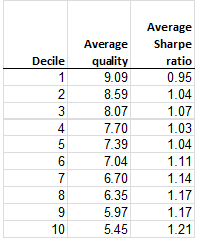
The association of declining quality with increasing Sharpe ratio is readily apparent. One possible interpretation could be that investors and ratings agencies persistently ascribe too high a default risk to low-quality corporate bonds. Therefore, the market consistently underprices them. Thus, when they survive better than expected, their returns are higher than expected. Low-quality bonds could be construed as the fixed-income counterpart of value stocks, which – according to some interpretations – are consistently underpriced and therefore have consistently high returns, because investors perceive them as riskier than they are.
(Another possible explanation could be survivorship bias. Low-quality funds with poor performance that existed earlier in the 10-year period could have been more likely to close than high-quality funds. Morningstar did not provide data for funds that no longer existed in 2013.)
This implies that to increase his or her chance of exhibiting persistently superior performance as measured by the Sharpe ratio, a manager of an intermediate-term bond fund need only invest in lower-quality bonds.
Are the results period-specific?
Of course, any of these results could be a function of the particular period of time that was studied. This possibility becomes more apparent when we try using a different measure of the possibility of performance persistence.
I calculated the five-year average Sharpe ratios for the 189 funds for both the 2004-08 and the 2009-13 periods.
If performance were merely random, then we would expect that of the funds that had above-median Sharpe ratios in the 2004-08 period, about half would be above the median Sharpe ratio in the 2009-13 period and half below.
But of those whose Sharpe ratios were above the median in the 2004-08 period, only 38% were in the upper half of performance in the 2009-13 period and 62% were below.
Can this reversion from the first five-year period to the second be explained? Recall that after the 2008 financial meltdown, there was a rush to quality. Large gaps in yields opened up between low-quality debt instruments and high-quality instruments, such as U.S. Treasury bonds. In the earlier period, the gaps had been small.
The takeaway
I've included in the Appendix a list of the 189 funds for which 10 years of data, including ratings (average credit quality), were available. Those funds are ranked by Sharpe ratio, and I included the Sharpe ratios for each of the two five-year subperiods, the standard deviation and the serial correlation of the Sharpe ratio. I caution against using this data as the basis for fund selection; rather, it should be used as a starting point for further research or as a confirmation of diligence you've already performed. The amount of history studied (10 years) is small and it did not encompass a full market cycle – the first 8.5 years were characterized by falling rates and rates rose only during the last year and a half. Further, I examined data only at the fund level, and did not incorporate manager changes.
It is very difficult in this case, as in most others, to make a positive attribution of superior historical performance to a cause. Further exploration of the data used for our investigations could yield more definitive results. But it is also possible that the data mining process might produce only spurious or evanescent implications, given the inevitable noisiness and temporally changing nature of investment results.
Michael Edesess, a mathematician and economist, is a visiting fellow with the Centre for Systems Informatics Engineering at City University of Hong Kong, a partner and chief investment officer of Denver-based Fair Advisors and a research associate at EDHEC-Risk Institute. In 2007, he authored a book about the investment services industry titled The Big Investment Lie, published by Berrett-Koehler. His new book, The Three Simple Rules of Investing, co-authored with Kwok L. Tsui, Carol Fabbri and George Peacock, will be published by Berrett-Koehler in spring 2014.
Appendix – Bond fund performance
|
Rank |
Name |
Ticker |
Average Sharpe Ratio |
Average Credit Quality 2004-13 |
2004-2008 avg Sharpe ratio |
2009-2013 avg Sharpe ratio |
Avg std dev 2004-2013 |
Serial correlation |
|
1 |
JPMorgan Mortgage-Backed Securities A |
OMBAX |
2.040 |
8.050 |
0.198 |
3.883 |
0.023 |
0.569 |
|
2 |
Frost Total Return Bond Inst |
FIJEX |
1.939 |
5.100 |
-0.128 |
4.007 |
0.030 |
0.130 |
|
3 |
TCW Total Return Bond I |
TGLMX |
1.774 |
6.450 |
0.358 |
3.191 |
0.030 |
0.113 |
|
4 |
Metropolitan West Total Return Bond M |
MWTRX |
1.702 |
7.050 |
0.354 |
3.050 |
0.033 |
0.034 |
|
5 |
Metropolitan West Intermediate Bond I |
MWIIX |
1.628 |
6.333 |
0.034 |
3.221 |
0.025 |
0.278 |
|
6 |
Commerce Bond |
CFBNX |
1.601 |
7.833 |
0.251 |
2.951 |
0.031 |
0.317 |
|
7 |
PIMCO Mortgage-Backed Securities Instl |
PTRIX |
1.568 |
8.500 |
0.318 |
2.817 |
0.027 |
0.088 |
|
8 |
Pioneer Bond A |
PIOBX |
1.534 |
9.150 |
-0.032 |
3.100 |
0.032 |
0.182 |
|
9 |
Putnam Income A |
PINCX |
1.521 |
6.700 |
-0.200 |
3.241 |
0.048 |
-0.002 |
|
10 |
TCW Core Fixed-Income I |
TGCFX |
1.518 |
6.600 |
0.163 |
2.873 |
0.032 |
0.397 |
|
11 |
Baird Core Plus Bond Inst |
BCOIX |
1.478 |
6.750 |
0.304 |
2.653 |
0.033 |
0.187 |
|
12 |
GMO Domestic Bond III |
GMDBX |
1.477 |
9.167 |
-0.254 |
3.208 |
0.035 |
0.039 |
|
13 |
JPMorgan Core Plus Bond A |
ONIAX |
1.472 |
5.100 |
-0.062 |
3.006 |
0.031 |
0.228 |
|
14 |
SEI Core Fixed Income A (SIIT) |
SCOAX |
1.461 |
7.500 |
0.110 |
2.812 |
0.032 |
0.305 |
|
15 |
Janus Aspen Flexible Bond Instl |
JAFLX |
1.460 |
5.850 |
0.266 |
2.655 |
0.033 |
0.272 |
|
16 |
USAA Income |
USAIX |
1.454 |
7.500 |
-0.110 |
3.019 |
0.034 |
0.293 |
|
17 |
Janus Flexible Bond D |
JANFX |
1.407 |
5.850 |
0.220 |
2.594 |
0.033 |
0.303 |
|
18 |
JHancock Bond A |
JHNBX |
1.402 |
5.333 |
-0.288 |
3.092 |
0.038 |
0.036 |
|
19 |
Franklin Strategic Mortgage A1 |
FSMIX |
1.402 |
8.556 |
-0.252 |
3.056 |
0.028 |
0.517 |
|
20 |
Cavanal Hill Intermediate Bd Inv |
APFBX |
1.382 |
6.429 |
-0.551 |
3.315 |
0.026 |
0.249 |
|
21 |
Federated Total Return Bond Instl |
FTRBX |
1.374 |
6.000 |
0.264 |
2.484 |
0.032 |
0.180 |
|
22 |
Lord Abbett Total Return I |
LTRYX |
1.373 |
6.750 |
0.126 |
2.620 |
0.035 |
0.295 |
|
23 |
Wells Fargo Advantage Income Plus A |
STYAX |
1.366 |
6.000 |
0.334 |
2.398 |
0.031 |
0.318 |
|
24 |
Scout Core Plus Bond Instl |
SCPZX |
1.364 |
6.450 |
0.319 |
2.410 |
0.053 |
0.187 |
|
25 |
Fidelity Total Bond |
FTBFX |
1.335 |
5.786 |
-0.093 |
2.763 |
0.034 |
0.296 |
|
26 |
BBH Limited Duration I |
BBBIX |
1.333 |
7.500 |
-0.027 |
2.693 |
0.024 |
0.297 |
|
27 |
Baird Intermediate Bond Inst |
BIMIX |
1.327 |
6.900 |
0.031 |
2.623 |
0.028 |
0.246 |
|
28 |
GuideStone Funds Medium-Duration Bd GS2 |
GMDYX |
1.321 |
6.500 |
0.129 |
2.513 |
0.038 |
0.242 |
|
29 |
Wells Fargo Advantage Core Bond Ad |
MNTRX |
1.314 |
8.813 |
0.163 |
2.465 |
0.033 |
0.382 |
|
30 |
Target Intermediate-Term Bond T |
TAIBX |
1.311 |
6.000 |
0.317 |
2.305 |
0.031 |
0.225 |
|
31 |
SEI Core Fixed Income A (SIMT) |
TRLVX |
1.302 |
5.500 |
-0.211 |
2.814 |
0.035 |
0.311 |
|
32 |
Cavanal Hill Bond Inv |
APBDX |
1.302 |
6.429 |
-0.469 |
3.072 |
0.030 |
0.434 |
|
33 |
USAA Intermediate-Term Bond |
USIBX |
1.301 |
6.000 |
-0.479 |
3.081 |
0.038 |
0.114 |
|
34 |
MassMutual Premier Diversified Bond A |
MDVAX |
1.299 |
7.500 |
-0.042 |
2.640 |
0.032 |
0.231 |
|
35 |
JPMorgan Core Bond Select |
WOBDX |
1.299 |
8.100 |
0.248 |
2.350 |
0.030 |
0.459 |
|
36 |
Westcore Plus Bond |
WTIBX |
1.287 |
6.333 |
0.186 |
2.388 |
0.031 |
0.252 |
|
37 |
Prudential Total Return Bond A |
PDBAX |
1.283 |
5.700 |
-0.026 |
2.592 |
0.038 |
0.141 |
|
38 |
Western Asset Core Plus Bond I |
WACPX |
1.275 |
7.278 |
0.010 |
2.541 |
0.045 |
0.288 |
|
39 |
Baird Aggregate Bond Inst |
BAGIX |
1.272 |
7.350 |
0.104 |
2.439 |
0.033 |
0.326 |
|
40 |
Western Asset Intermediate Bond I |
WATIX |
1.260 |
6.600 |
0.016 |
2.504 |
0.033 |
0.155 |
|
41 |
Virtus Bond I |
SAVYX |
1.258 |
6.000 |
0.020 |
2.496 |
0.035 |
0.213 |
|
42 |
Scout Core Bond I |
SCCIX |
1.253 |
8.250 |
0.124 |
2.383 |
0.045 |
0.350 |
|
43 |
JHancock Investment Grade Bond A |
TAUSX |
1.253 |
7.000 |
-0.279 |
2.786 |
0.034 |
0.140 |
|
44 |
Delaware Diversified Income A |
DPDFX |
1.250 |
5.000 |
0.391 |
2.108 |
0.041 |
-0.223 |
|
45 |
Loomis Sayles Investment Grade F/I |
LSIGX |
1.246 |
6.000 |
0.447 |
2.046 |
0.060 |
-0.265 |
|
46 |
Nationwide HighMark Bond InSvc |
NWJJX |
1.243 |
7.667 |
0.073 |
2.414 |
0.031 |
0.320 |
|
47 |
ASTON/TCH Fixed Income N |
CHTBX |
1.237 |
6.188 |
-0.017 |
2.491 |
0.038 |
0.098 |
|
48 |
Nationwide Core Plus Bond Instl |
NWCIX |
1.237 |
6.900 |
-0.139 |
2.612 |
0.036 |
0.228 |
|
49 |
Morgan Stanley Inst Core Plus FI Instl |
MPFIX |
1.234 |
8.000 |
-0.130 |
2.599 |
0.031 |
0.035 |
|
50 |
Hennessy Core Bond Institutional |
HCBIX |
1.230 |
5.667 |
0.550 |
1.911 |
0.036 |
-0.148 |
|
51 |
Hartford Total Return Bond HLS IA |
HIABX |
1.230 |
5.850 |
-0.164 |
2.624 |
0.034 |
0.233 |
|
52 |
MassMutual Premier Core Bond S |
MCBDX |
1.218 |
6.000 |
0.069 |
2.367 |
0.033 |
0.304 |
|
53 |
Dodge & Cox Income |
DODIX |
1.214 |
5.850 |
-0.023 |
2.450 |
0.032 |
0.299 |
|
54 |
Delaware Pooled Core Plus Fixed Income |
DCPFX |
1.213 |
6.500 |
0.079 |
2.346 |
0.036 |
0.201 |
|
55 |
Loomis Sayles Core Plus Bond A |
NEFRX |
1.208 |
5.813 |
0.102 |
2.313 |
0.045 |
0.240 |
|
56 |
MainStay Intermediate Term Bond I |
MTMIX |
1.203 |
6.000 |
0.204 |
2.203 |
0.033 |
0.452 |
|
57 |
T. Rowe Price New Income |
PRCIX |
1.203 |
7.200 |
0.175 |
2.231 |
0.033 |
0.289 |
|
58 |
Russell Strategic Bond I |
RFCSX |
1.199 |
5.438 |
-0.088 |
2.487 |
0.035 |
0.062 |
|
59 |
Touchstone Total Return Bond Y |
TCPYX |
1.197 |
6.450 |
-0.176 |
2.570 |
0.032 |
0.471 |
|
60 |
Wilmington Intermediate-Term Bond Instl |
ARIFX |
1.193 |
6.750 |
0.126 |
2.261 |
0.026 |
0.356 |
|
61 |
MFS® Research Bond A |
MRBFX |
1.186 |
8.000 |
-0.285 |
2.657 |
0.034 |
0.238 |
|
62 |
PIMCO Moderate Duration Instl |
PMDRX |
1.185 |
9.000 |
0.179 |
2.191 |
0.035 |
0.106 |
|
63 |
Fidelity Mortgage Secs |
FMSFX |
1.185 |
8.286 |
-0.352 |
2.722 |
0.024 |
0.436 |
|
64 |
Managers Bond Service |
MGFIX |
1.182 |
6.667 |
0.118 |
2.247 |
0.057 |
-0.072 |
|
65 |
FundX Flexible Income |
INCMX |
1.179 |
5.100 |
0.242 |
2.117 |
0.035 |
-0.119 |
|
66 |
Lord Abbett Core Fixed Income I |
LCRYX |
1.178 |
8.550 |
0.166 |
2.190 |
0.034 |
0.352 |
|
67 |
Nationwide Bond Institutional Service |
MUIBX |
1.171 |
5.667 |
-0.038 |
2.381 |
0.034 |
0.088 |
|
68 |
Transamerica Instl Asset Allc Shrt Hrzn |
DISHX |
1.164 |
5.357 |
0.072 |
2.255 |
0.035 |
0.090 |
|
69 |
Loomis Sayles Investment Grade Bond A |
LIGRX |
1.163 |
6.000 |
0.403 |
1.924 |
0.060 |
-0.268 |
|
70 |
Loomis Sayles Interm Duration Bond Instl |
LSDIX |
1.161 |
7.167 |
-0.174 |
2.496 |
0.031 |
0.293 |
|
71 |
Fidelity Investment Grade Bond |
FBNDX |
1.151 |
7.500 |
-0.309 |
2.611 |
0.033 |
0.370 |
|
72 |
Russell Investment Grade Bond I |
RFASX |
1.150 |
7.125 |
-0.019 |
2.320 |
0.034 |
0.297 |
|
73 |
GE RSP Income |
GESLX |
1.150 |
7.050 |
0.072 |
2.228 |
0.032 |
0.463 |
|
74 |
Dreyfus Intermediate Term Income A |
DRITX |
1.148 |
6.600 |
-0.185 |
2.481 |
0.037 |
0.358 |
|
75 |
RS Investment Quality Bond A |
GUIQX |
1.146 |
7.875 |
-0.022 |
2.313 |
0.031 |
0.397 |
|
76 |
Great-West Federated Bond Init |
MXFDX |
1.144 |
6.333 |
0.102 |
2.186 |
0.033 |
0.342 |
|
77 |
PIMCO Total Return III Instl |
PTSAX |
1.144 |
7.750 |
0.383 |
1.905 |
0.039 |
-0.086 |
|
78 |
PNC Total Return Advantage I |
PTVIX |
1.139 |
7.333 |
0.211 |
2.067 |
0.033 |
0.419 |
|
79 |
GE Instl Income Inv |
GFIIX |
1.139 |
7.050 |
0.041 |
2.236 |
0.031 |
0.456 |
|
80 |
TIAA-CREF Bond Instl |
TIBDX |
1.138 |
7.833 |
0.184 |
2.092 |
0.032 |
0.367 |
|
81 |
Aberdeen Total Return Bond A |
BJBGX |
1.136 |
8.357 |
0.253 |
2.018 |
0.036 |
0.358 |
|
82 |
Harbor Bond Institutional |
HABDX |
1.133 |
6.900 |
0.345 |
1.920 |
0.039 |
-0.070 |
|
83 |
Bernstein Intermediate Dur Inst |
SIIDX |
1.122 |
6.450 |
-0.075 |
2.318 |
0.035 |
0.360 |
|
84 |
Elfun Income |
EINFX |
1.121 |
6.900 |
0.063 |
2.178 |
0.032 |
0.458 |
|
85 |
ING Intermediate Bond Port I |
IPIIX |
1.119 |
6.300 |
-0.193 |
2.432 |
0.034 |
0.270 |
|
86 |
VALIC Company II Core Bond |
VCCBX |
1.113 |
6.000 |
-0.155 |
2.380 |
0.036 |
0.259 |
|
87 |
Transamerica Partners Instl Core Bond |
DICBX |
1.107 |
7.125 |
-0.004 |
2.218 |
0.034 |
0.251 |
|
88 |
Touchstone Core Bond A |
TOBAX |
1.106 |
4.950 |
-0.300 |
2.511 |
0.032 |
0.313 |
|
89 |
Columbia Intermediate Bond Z |
SRBFX |
1.102 |
6.333 |
-0.112 |
2.316 |
0.035 |
0.212 |
|
90 |
Principal Income A |
CMPIX |
1.101 |
9.556 |
-0.042 |
2.244 |
0.041 |
0.069 |
|
91 |
Bernstein Intermediate Duration |
SNIDX |
1.096 |
6.750 |
-0.047 |
2.239 |
0.036 |
0.320 |
|
92 |
Managers PIMCO Bond |
MBDFX |
1.095 |
7.500 |
0.217 |
1.973 |
0.040 |
-0.001 |
|
93 |
Northern Core Bond |
NOCBX |
1.095 |
7.200 |
0.109 |
2.081 |
0.033 |
0.444 |
|
94 |
Western Asset Mortgage Backed Sec B |
HGVSX |
1.092 |
7.778 |
-0.291 |
2.475 |
0.027 |
0.626 |
|
95 |
JIC Institutional Bond Fund II |
JIBEX |
1.092 |
8.000 |
0.147 |
2.036 |
0.027 |
0.502 |
|
96 |
American Century Diversified Bond Instl |
ACBPX |
1.092 |
8.000 |
0.318 |
1.865 |
0.032 |
0.424 |
|
97 |
BNY Mellon Bond M |
MPBFX |
1.087 |
8.700 |
0.217 |
1.957 |
0.030 |
0.456 |
|
98 |
ING PIMCO Total Return Bond Port S |
IPCSX |
1.085 |
6.750 |
0.393 |
1.777 |
0.039 |
-0.106 |
|
99 |
Optimum Fixed Income A |
OAFIX |
1.085 |
8.750 |
-0.195 |
2.365 |
0.036 |
0.047 |
|
100 |
PIMCO Total Return II Instl |
PMBIX |
1.083 |
8.000 |
0.279 |
1.887 |
0.037 |
0.278 |
|
101 |
Goldman Sachs Core Fxd-Inc Instl |
GSFIX |
1.079 |
8.250 |
-0.079 |
2.237 |
0.037 |
0.226 |
|
102 |
Praxis Intermediate Income A |
MIIAX |
1.074 |
5.833 |
0.045 |
2.104 |
0.031 |
0.403 |
|
103 |
Columbia Bond Z |
UMMGX |
1.074 |
8.438 |
0.117 |
2.031 |
0.032 |
0.359 |
|
104 |
Neuberger Berman Core Bond Inst |
NCRLX |
1.073 |
9.000 |
-0.080 |
2.226 |
0.036 |
0.317 |
|
105 |
GMO Core Plus Bond III |
GUGAX |
1.069 |
8.500 |
-0.819 |
2.958 |
0.044 |
0.446 |
|
106 |
Tributary Income Instl |
FOINX |
1.069 |
7.125 |
-0.086 |
2.225 |
0.031 |
0.478 |
|
107 |
Managers AMG GW&K Fixed Income Instl |
MFDYX |
1.059 |
6.150 |
0.265 |
1.854 |
0.053 |
-0.024 |
|
108 |
AllianceBern Interm Bond A |
ABQUX |
1.056 |
7.286 |
-0.223 |
2.335 |
0.036 |
0.252 |
|
109 |
Mutual of America Bond Instl |
MABOX |
1.055 |
8.550 |
0.132 |
1.978 |
0.031 |
0.385 |
|
110 |
Ave Maria Bond |
AVEFX |
1.053 |
9.000 |
0.057 |
2.048 |
0.033 |
0.440 |
|
111 |
RidgeWorth Total Return Bond I |
SAMFX |
1.050 |
7.667 |
0.340 |
1.761 |
0.032 |
0.352 |
|
112 |
American Beacon Intermediate Bd Instl |
AABDX |
1.048 |
8.357 |
0.313 |
1.784 |
0.033 |
0.405 |
|
113 |
Western Asset Core Bond I |
WATFX |
1.048 |
7.700 |
-0.267 |
2.363 |
0.047 |
0.447 |
|
114 |
JIC Institutional Bond Fund III |
JIBFX |
1.044 |
8.000 |
0.222 |
1.867 |
0.035 |
0.482 |
|
115 |
Morgan Stanley Inst Core Fixed Inc |
MPSFX |
1.035 |
6.938 |
-0.066 |
2.135 |
0.031 |
0.118 |
|
116 |
Sterling Capital Total Return Bond A |
BICAX |
1.035 |
7.125 |
0.012 |
2.058 |
0.035 |
0.428 |
|
117 |
Franklin Total Return A |
FKBAX |
1.034 |
6.000 |
-0.085 |
2.154 |
0.038 |
0.198 |
|
118 |
ING Intermediate Bond A |
IIBAX |
1.033 |
6.150 |
-0.315 |
2.381 |
0.035 |
0.253 |
|
119 |
Hartford Total Return Bond A |
ITBAX |
1.032 |
6.000 |
-0.307 |
2.372 |
0.033 |
0.293 |
|
120 |
Dreyfus GNMA Z |
DRGMX |
1.026 |
9.600 |
0.142 |
1.909 |
0.026 |
0.559 |
|
121 |
BlackRock Core Bond Instl |
BFMCX |
1.025 |
8.550 |
-0.131 |
2.181 |
0.034 |
0.127 |
|
122 |
Delaware Core Plus Bond A |
DEGGX |
1.025 |
7.667 |
-0.161 |
2.210 |
0.038 |
0.334 |
|
123 |
American Indep BoydWatterson Core Pls I |
IIISX |
1.024 |
7.500 |
0.154 |
1.894 |
0.029 |
0.428 |
|
124 |
Transamerica Asset Allc Short Horizon |
DVCSX |
1.019 |
5.357 |
-0.094 |
2.131 |
0.036 |
0.117 |
|
125 |
Calvert Bond A |
CSIBX |
1.014 |
6.833 |
0.230 |
1.798 |
0.033 |
-0.129 |
|
126 |
Northern Fixed Income |
NOFIX |
1.003 |
7.500 |
0.015 |
1.990 |
0.033 |
0.476 |
|
127 |
ING PIMCO Total Return Port I |
IPTIX |
0.991 |
7.200 |
0.297 |
1.685 |
0.042 |
-0.133 |
|
128 |
Transamerica Partners Core Bond |
DVGCX |
0.984 |
7.125 |
-0.105 |
2.073 |
0.034 |
0.255 |
|
129 |
BlackRock Bond Index K |
WFBIX |
0.983 |
9.000 |
0.342 |
1.623 |
0.033 |
0.476 |
|
130 |
Fidelity Intermediate Bond |
FTHRX |
0.977 |
6.857 |
-0.430 |
2.385 |
0.030 |
0.326 |
|
131 |
RidgeWorth Intermediate Bond I |
SAMIX |
0.977 |
7.500 |
0.352 |
1.601 |
0.028 |
0.368 |
|
132 |
T. Rowe Price U.S. Bond Enhanced Index |
PBDIX |
0.973 |
9.000 |
0.235 |
1.710 |
0.033 |
0.485 |
|
133 |
American Funds Bond Fund of Amer A |
ABNDX |
0.963 |
6.000 |
-0.223 |
2.150 |
0.035 |
0.225 |
|
134 |
Oppenheimer Core Bond A |
OPIGX |
0.956 |
5.500 |
-0.259 |
2.172 |
0.058 |
0.354 |
|
135 |
Highland Fixed Income A |
HFBAX |
0.951 |
7.071 |
-0.073 |
1.975 |
0.032 |
0.489 |
|
136 |
DWS US Bond Index Inst |
BTUSX |
0.949 |
9.000 |
0.302 |
1.597 |
0.033 |
0.436 |
|
137 |
Morgan Stanley Instl Corporate Bond I |
MPFDX |
0.947 |
7.714 |
-0.109 |
2.002 |
0.035 |
0.106 |
|
138 |
PNC Intermediate Bond I |
PIKIX |
0.943 |
6.429 |
0.008 |
1.877 |
0.028 |
0.326 |
|
139 |
DWS Core Plus Income S |
SCSBX |
0.942 |
6.450 |
-0.368 |
2.252 |
0.037 |
0.161 |
|
140 |
Wright Total Return Bond |
WTRBX |
0.938 |
8.250 |
-0.071 |
1.947 |
0.033 |
0.419 |
|
141 |
Vanguard Total Bond Market Index Inv |
VBMFX |
0.937 |
9.100 |
0.293 |
1.582 |
0.033 |
0.467 |
|
142 |
Payden Core Bond |
PYCBX |
0.933 |
7.750 |
-0.101 |
1.967 |
0.038 |
0.098 |
|
143 |
Calvert Income A |
CFICX |
0.927 |
5.667 |
-0.016 |
1.870 |
0.038 |
-0.105 |
|
144 |
Dreyfus Bond Market Index Basic |
DBIRX |
0.922 |
9.000 |
0.306 |
1.537 |
0.033 |
0.462 |
|
145 |
Thrivent Opportunity Income Plus A |
AAINX |
0.920 |
6.667 |
-0.612 |
2.453 |
0.035 |
0.333 |
|
146 |
Ivy Bond A |
IBOAX |
0.919 |
6.150 |
-0.807 |
2.646 |
0.030 |
0.355 |
|
147 |
Fidelity Spartan US Bond Idx Investor |
FBIDX |
0.918 |
8.786 |
0.154 |
1.681 |
0.032 |
0.497 |
|
148 |
Aberdeen Core Fixed Income A |
PCDFX |
0.903 |
8.625 |
0.033 |
1.773 |
0.033 |
0.461 |
|
149 |
MainStay Indexed Bond I |
MIXIX |
0.901 |
6.833 |
0.264 |
1.537 |
0.033 |
0.482 |
|
150 |
VALIC Company I Capital Conservation |
VCCCX |
0.896 |
7.000 |
-0.261 |
2.053 |
0.033 |
0.437 |
|
151 |
Nuveen Core Plus Bond A |
FAFIX |
0.896 |
6.333 |
-0.253 |
2.044 |
0.042 |
0.105 |
|
152 |
Great-West Bond Index Init |
MXBIX |
0.889 |
8.500 |
0.225 |
1.553 |
0.033 |
0.492 |
|
153 |
Wilmington Broad Market Bond Instl |
ARKIX |
0.888 |
6.750 |
-0.103 |
1.879 |
0.034 |
0.396 |
|
154 |
State Farm Bond A Legacy |
SFBAX |
0.883 |
7.800 |
0.024 |
1.743 |
0.035 |
0.266 |
|
155 |
BNY Mellon Intermediate Bond M |
MPIBX |
0.878 |
8.700 |
-0.002 |
1.758 |
0.026 |
0.468 |
|
156 |
DWS Core Fixed Income Inst |
MFINX |
0.874 |
7.800 |
-0.275 |
2.023 |
0.034 |
0.253 |
|
157 |
Parnassus Fixed-Income |
PRFIX |
0.870 |
7.313 |
0.441 |
1.300 |
0.027 |
0.186 |
|
158 |
Delaware Core Bond A |
DPFIX |
0.869 |
8.833 |
0.008 |
1.729 |
0.032 |
0.294 |
|
159 |
Vantagepoint Core Bond Index I |
VPCIX |
0.866 |
9.000 |
0.182 |
1.551 |
0.033 |
0.474 |
|
160 |
Hancock Horizon Core Bond A |
HHBAX |
0.862 |
7.167 |
-0.059 |
1.784 |
0.029 |
0.470 |
|
161 |
Nuveen Core Bond I |
FINIX |
0.862 |
7.333 |
-0.275 |
1.998 |
0.035 |
0.012 |
|
162 |
GuideMark Core Fixed Income Service |
GMCOX |
0.855 |
7.500 |
-0.194 |
1.904 |
0.036 |
0.252 |
|
163 |
PACE Intermediate Fixed Income P |
PCIFX |
0.849 |
7.750 |
-0.095 |
1.793 |
0.028 |
0.211 |
|
164 |
Johnson Fixed-Income |
JFINX |
0.848 |
8.063 |
0.103 |
1.594 |
0.029 |
0.505 |
|
165 |
UBS Core Plus Bond Y |
BPBDX |
0.848 |
7.000 |
-0.793 |
2.488 |
0.030 |
0.401 |
|
166 |
CRA Qualified Investment CRA |
CRAIX |
0.848 |
9.056 |
0.154 |
1.541 |
0.029 |
0.399 |
|
167 |
Vanguard Interm-Term Bond Index Inv |
VBIIX |
0.826 |
7.650 |
0.207 |
1.444 |
0.050 |
0.394 |
|
168 |
Guggenheim Investment Grade Bond A |
SIUSX |
0.826 |
6.667 |
-0.750 |
2.402 |
0.033 |
0.533 |
|
169 |
Bishop Street High Grade Inc Instl |
BSHGX |
0.825 |
7.500 |
0.165 |
1.485 |
0.038 |
0.458 |
|
170 |
Nationwide Bond Index A |
GBIAX |
0.802 |
6.000 |
0.136 |
1.468 |
0.032 |
0.478 |
|
171 |
PNC Bond A |
PAAAX |
0.791 |
8.250 |
-0.007 |
1.590 |
0.034 |
0.408 |
|
172 |
Old Westbury Fixed Income |
OWFIX |
0.789 |
6.450 |
0.336 |
1.242 |
0.028 |
0.343 |
|
173 |
RidgeWorth Core Bond Fund A |
STGIX |
0.787 |
7.667 |
0.298 |
1.277 |
0.039 |
0.284 |
|
174 |
BlackRock Total Return Inv C |
MFHQX |
0.776 |
7.500 |
-0.601 |
2.153 |
0.037 |
0.162 |
|
175 |
Domini Social Bond Inv |
DSBFX |
0.768 |
8.833 |
0.016 |
1.521 |
0.027 |
0.501 |
|
176 |
Waddell & Reed Bond A |
UNBDX |
0.741 |
6.750 |
-0.081 |
1.563 |
0.033 |
0.355 |
|
177 |
Principal Bond & Mtg Securities R2 |
PBMNX |
0.737 |
9.000 |
-0.682 |
2.155 |
0.038 |
0.338 |
|
178 |
Huntington Fixed-Income Securities Instl |
HFISX |
0.722 |
7.833 |
0.086 |
1.358 |
0.035 |
0.454 |
|
179 |
BMO Short-Intermediate Bond Y |
MAIBX |
0.706 |
7.500 |
-0.483 |
1.895 |
0.040 |
0.409 |
|
180 |
Forward Investment Grade Fxd-Inc Instl |
AIFIX |
0.680 |
5.700 |
-0.150 |
1.510 |
0.044 |
0.472 |
|
181 |
Monteagle Fixed Income I |
MFHRX |
0.644 |
8.063 |
-0.147 |
1.435 |
0.026 |
0.490 |
|
182 |
Timothy Plan Fixed Income A |
TFIAX |
0.635 |
7.875 |
-0.257 |
1.528 |
0.034 |
0.421 |
|
183 |
TETON Westwood Intermediate Bond AAA |
WEIBX |
0.624 |
9.000 |
0.042 |
1.205 |
0.029 |
0.466 |
|
184 |
Pioneer Government Income A |
AMGEX |
0.607 |
7.750 |
0.110 |
1.105 |
0.029 |
0.425 |
|
185 |
Stratus Government Securities Inst |
STGSX |
0.606 |
8.167 |
-0.087 |
1.298 |
0.023 |
0.487 |
|
186 |
Madison Core Bond A |
MBOAX |
0.528 |
8.400 |
0.082 |
0.975 |
0.031 |
0.455 |
|
187 |
Saratoga Investment Quality Bond I |
SIBPX |
0.481 |
6.000 |
-0.227 |
1.189 |
0.027 |
0.382 |
|
188 |
Hartford US Government Secs HLS IA |
HAUSX |
0.455 |
9.100 |
-0.446 |
1.355 |
0.024 |
0.407 |
|
189 |
MainStay Government B |
MCSGX |
0.430 |
8.833 |
-0.028 |
0.887 |
0.030 |
0.315 |
Membership required
Membership is now required to use this feature. To learn more:
View Membership BenefitsSponsored Content
Upcoming Virtual Events View All


