Advisor Perspectives welcomes guest contributions. The views presented here do not necessarily represent those
of Advisor Perspectives.
The low-yield environment manufactured by central banks has encouraged and precipitated yield-seeking speculation.
Investors and speculators alike have taken up a near-religious conviction in the demi-god status of central bankers.
Will these central bankers continue to enjoy their god-like status indefinitely or will they disappoint their
followers?
In one of our earlier articles, US Equities:
Overvalued or Undervalued, we surveyed the historical experience of valuation tools. In that article, we
observed that the U.S. equity markets are priced for very low subsequent investment returns. This article adds to
the historical experience by providing an overview of the potential risk that investors face, should we enter a bear
market.
A market on steroids
Since the depth of the March 2009 bottom, the U.S. stock markets have more than trebled, having risen by about
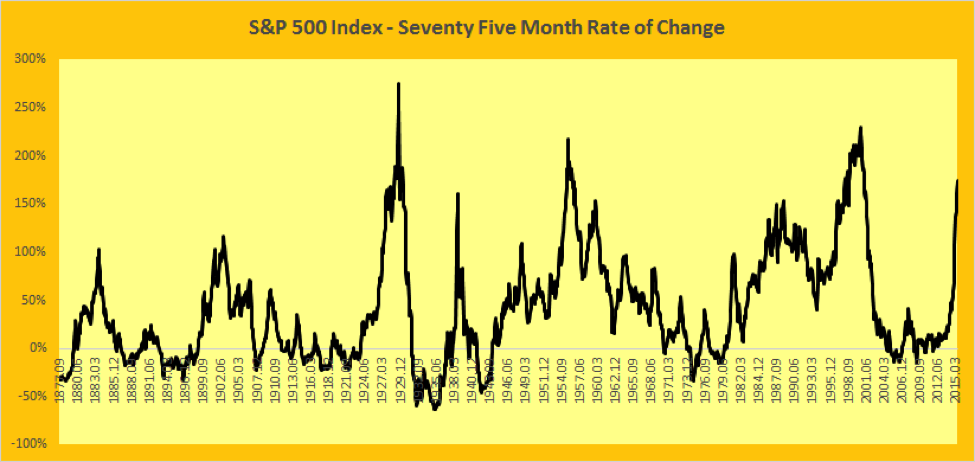
215%2 over a period of 75 months. Figure 1 shows the 75-month rate of change for the S&P500 Index for
the last 140 years. The reason for using a 75-month rate of change is that the length of market’s current move
from its trough is 75 months. Clearly, the current rate of change is in extreme territory and is exceeded only by
three other market up-moves: the roaring bull market of twenties leading into the Great Depression, the bull market
of the fifties and the technology boom. Further, the trajectory of the up-move is similar to that of the market
leading into the highs of 1929 and the highs in 19383.
We have had a market on potent steroids.
Figure 1

Sub-par economic growth
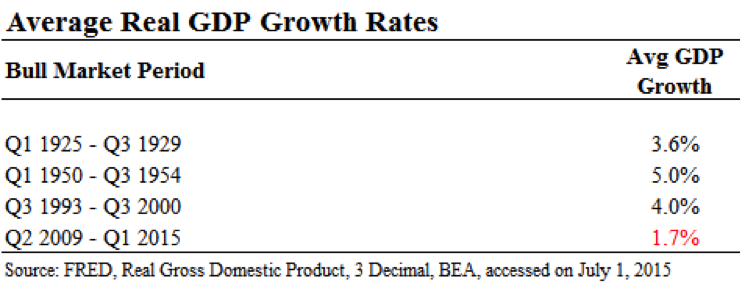
Interestingly, this strong performance of the U.S. equity markets has taken place while the broader economy hasn’t
really done all that well. Economic growth rates have been sub-par for much of this equity market rally. Table 1
shows the average real GDP growth rates experienced during the three market up moves discussed earlier where the
rate of change exceeded that of the current market. For comparison, we have provided the GDP growth rates
experienced thus far during this up move.
Table 14
A bull market or a new market?
Naturally, this has prompted many astute market participants to raise questions about the sustainability of current
price levels. John Hussman, Jeremy Grantham and others have pointed out the significant overvaluation of U.S.
equities. On the other hand, many find the markets to be fairly valued based on a different set of valuation tools.
The key point of contention between these two groups is the selection and application of valuation tools. However,
there is a much more basic issue that investors have to contend with. As Benjamin Graham so eloquently put
it, “The main issue before the investor may be expressed this way: Have we been in a bull market or in a new
sort of market?5"
If we are in a bull market, we will indeed have a bear market following it. It is much like how night is inevitable
after day. However, if you believe that we are in a new market where central bankers’ superpower is sufficient
to fend off any bearish inclinations without regard to valuations, then the valuation question is irrelevant. In
such a case, the inevitability of the bear market doesn’t hold.
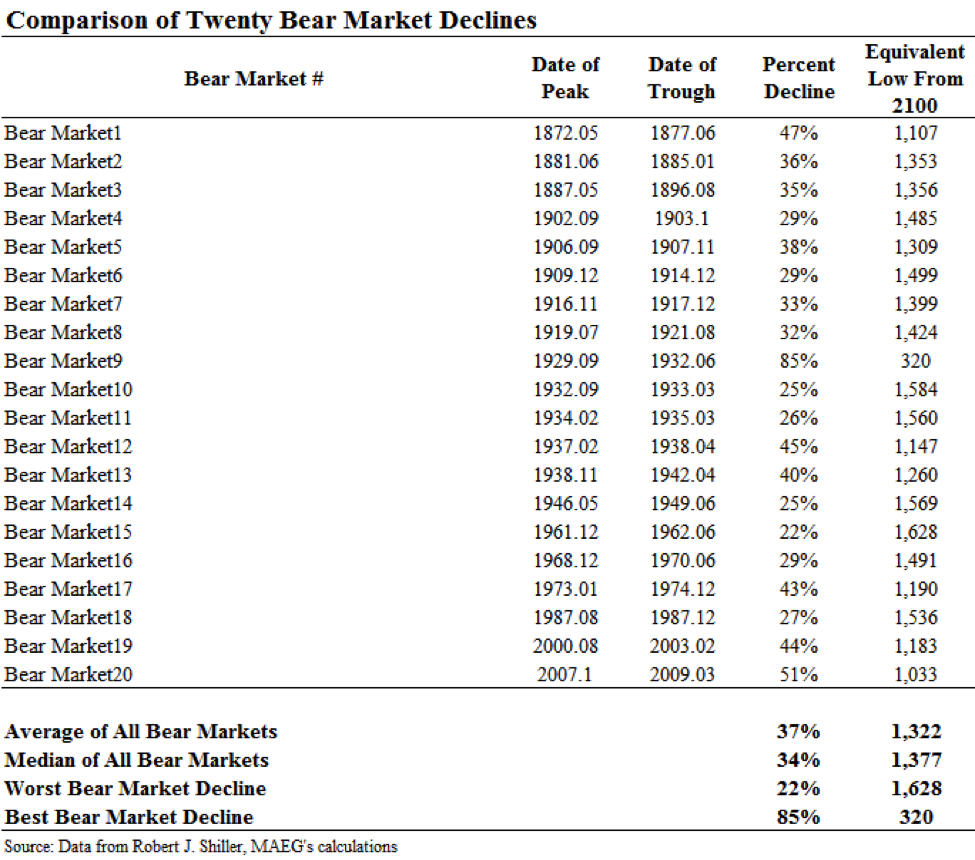
Assuming we are in a bull market, it will pay to understand the kind of declines we could experience if we were to
enter a bear market. Table 26 shows the declines experienced during the last 20 bear markets over the
past 140 years7. The right-most column applies these declines to the recent S&P500 high of 2,100.
Table 2
As shown in Table 2, a decline that is equivalent to the average of all 20 bear markets will indicate a market low
of about 1,300 in the S&P 500, a fall of nearly 40%. None of this analysis means that a decline of this extent,
or any decline at all, is imminent. However, an investor will do well to prepare herself mentally for such a decline
and understand that a ≈40% decline in a bear market is a rather normal event.
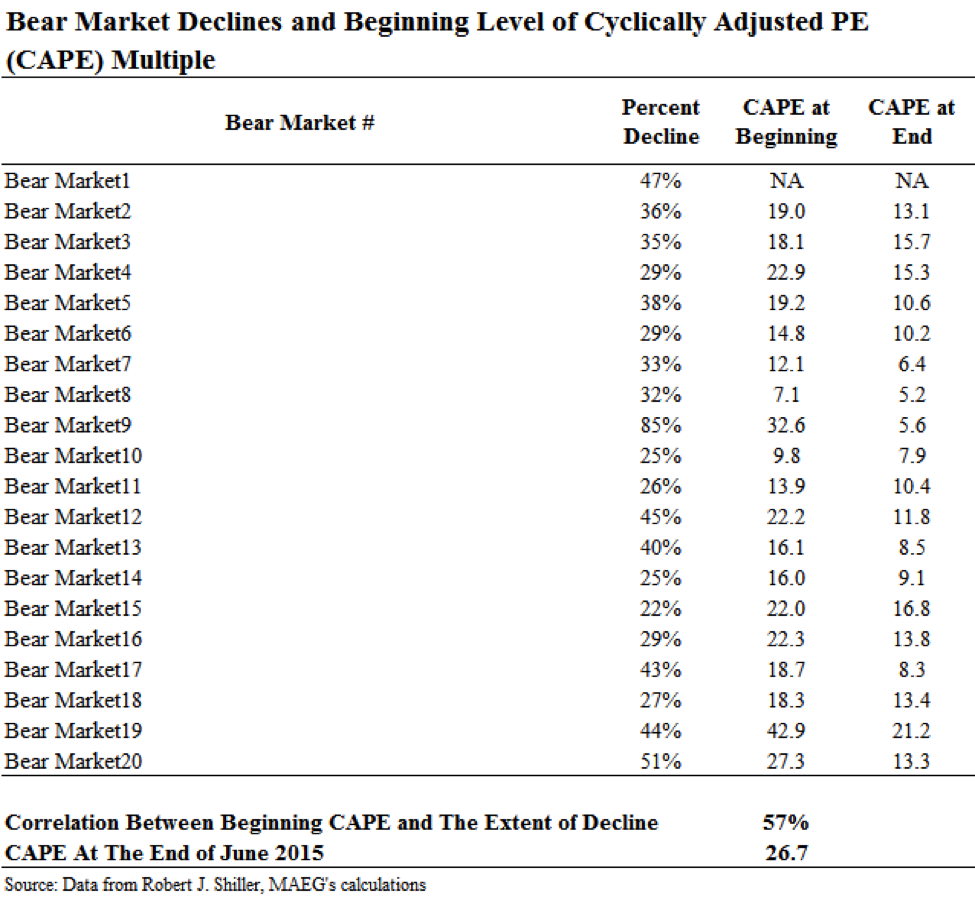
That is not all that we can learn from past experience. As we would have expected, there is a significant
relationship between valuation levels at the beginning of a bear market and the subsequent decline experienced.
Table 3 shows the level of cyclically adjusted price to earnings (CAPE) ratio at the beginning and end of each one
of the past 20 bear markets except for the first one8.
Table 3
The correlation between beginning CAPE levels and the subsequent declines experienced is 57%. What this means is
that the higher the CAPE at beginning, the larger the subsequent decline. The CAPE multiple at the end of June 2015
was nearly 27, higher than 17 of the past 20 bear markets.
Investors will be well served to keep in mind and mentally prepare for what historical experience has taught us
regarding market fluctuations during a bear market. We don’t recommending jumping ship. But ensure that you
have your life jackets and safety boats ready and at your disposal.
Baijnath Ramraika, CFA, is the CEO and CIO at Multi-Act EquiGlobe Limited (MAEG). Contact him at
[email protected]. Prashant Trivedi, CFA, is the Chairman at MAEG and is the founding chairman of Multi-Act
Trade and Investments Pvt. Ltd. MAEG is an investment manager based in Mauritius managing investment funds
focused on high quality businesses.
Read more articles by Baijnath Ramraika, Prashant Trivedi