A striking feature of the U.S. stock market’s reaction to the spread of the coronavirus outside of China has been the magnitude and frequency of large daily swings. The 1,000-plus point drop in the Dow that first occurred on Monday, February 24, 2020, was certainly an eye-opener. But that was just the initial shock delivered by the market; since that time, we have felt numerous “aftershocks” as large or larger.
My colleague Sheldon McFarland, a member of our Investment Policy Committee, looked into the question of whether such aftershocks are a surprise. The following is a write-up of his findings as well as what conclusions we should draw.
If we assume daily returns are normally distributed, large declines or “shocks” should be infrequent. But historical evidence shows the distribution of daily returns is, in fact, not normal – it is fat-tailed, so shocks occur more frequently than we would expect given the assumption of normality. For example, in their book, The (mis)Behavior of Markets, authors Benoit Mandelbrot and Richard Hudson showed that if returns were normally distributed, we should expect the market to experience a daily move of greater than 7% once every 300,000 years. Yet over the period 916 to 2003, the Dow Jones Industrial Average experienced 48 such moves! Evidence also shows that large moves tend to cluster together, i.e., shocks are followed by aftershocks in the market. And this “volatility clustering” is not the result of the markets being fat-tailed but is rather a behavioral reaction that occurs in addition to there being a greater number of large shocks.
We used a simulation technique1 to run one million simulations of daily Dow returns that takes into account the fat-tailed nature of all the daily Dow returns going back to 1900 to help us identify this volatility clustering. Based on the actual history of daily Dow returns, we found that the shock that occurred on February 24 (a drop of -3.56%, or worse) should only occur about once every six months. But as soon as that shock occurred, there were six days within the next 11 business days when the market swung (up OR down) with the same ferocity. How could so many aftershocks in the market – which are supposed to be infrequent – come so close together? We used our simulated dataset, compared to the actual history of the Dow, to help us investigate this question.
Surprisingly, research has shown such aftershocks are regular phenomena. A simple analogy (especially for those who live in California!) would be that of earthquakes. Even in California, earthquakes that are strong enough to be felt are rare. But once we DO, it is not unusual to feel aftershocks for days or even weeks thereafter. A similar phenomenon occurs in the stock markets, but for reasons having to do with investor behavior, not tectonic plates.
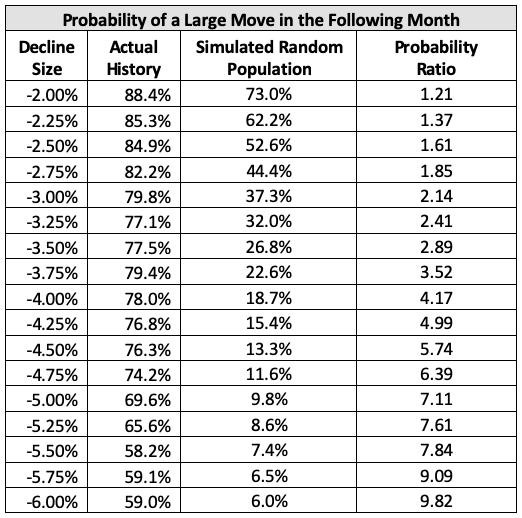
We did a quick analysis to illustrate this point.2 We compiled daily percentage swings in the Dow Jones Industrial Average (DJIA) from January 1900 through December 2019 (more than 30,000 daily changes). We then identified what happened in the month after the market experienced a shock. We looked at a variety of shocks, ranging from -2% to -6%. We then looked to see what the likelihood was, in the month following the shock, of an aftershock (up OR down).