New Estimates of the Need for Long-Term Care
Membership required
Membership is now required to use this feature. To learn more:
View Membership BenefitsWhen the subject of long-term care (LTC) comes up, advisors need to be able to discuss with clients the likelihood of needing such care and its potential duration. These discussions feed into decisions about whether to purchase LTC insurance. In this February 2020 article (and APViewpoint conversation), Allan Roth got the discussion going in terms of both the probabilities of needing care and an evaluation of insurance options. Recently I have analyzed additional data that improves our understanding of LTC needs and informs the decision-making about insurance.
The primary data that Roth used for projecting LTC needs was based on a study of nursing home utilization. In the APViewpoint discussion that followed I, and one other participant, noted that it would be useful to have data that included LTC utilization in the broader context including both home care and assisted living. Using my actuarial affiliations I was able to find actuarial data on claims and other studies of projected LTC needs, primarily from the Society of Actuaries (SOA). The SOA conducts peer-reviewed studies of LTC claims every three years or so, including data from most of the LTC insurance carriers in the U.S.
Estimating LTC needs
Unfortunately there is no single source that provides official statistics on the utilization of LTC services or how much care retirees need, so it’s necessary to examine a variety of sources. These include surveys of the elderly population, such as the recurring Health and Retirement Survey (HRS), claims data from LTC insurers consolidated by the Society of Actuaries, and projection models developed by researchers.
The chart below compares estimates of long-term care needs from the following sources:
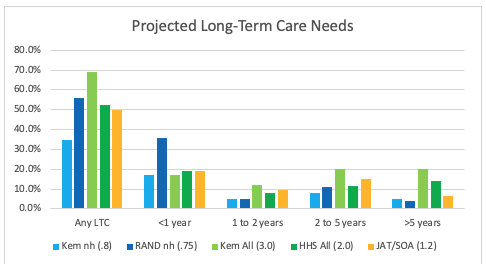
2005 study from Kemper, Komisar, and Aecxih that used modeling to project both nursing home use and overall lifetime LTC needs.
2017 RAND study by Hurd, Michaud, and Rohwedder that used HRS data to estimate lifetime nursing home use for retirement-age individuals. (I’ve interpolated the results in the RAND study to match durations for the other studies.) The RAND study was the primary source used by Allan Roth.
2015/2016 HHS-sponsored study from Favreault and Dee that used modeling to project overall lifetime LTC needs for retirees.
Estimates of LTC claims incidence, durations, and benefit utilization I developed from the 2015 Society of Actuaries Basic Table models for LTC experience.
The ”any LTC” columns in the chart are estimates of the percentage of individuals who will experience any LTC need over the course of retirement. The columns to the right of it break down the any LTC percentages into duration groups. Average-need durations in years, including zeros for those not needing LTC, are shown in parenthesis.
The leftmost blue and darker blue columns are estimates for nursing home use only. The main difference between Kemper et al. and RAND is in the less than one-year category. The RAND study provided estimates for any nursing home use, including short-term rehabilitation, while Kemper modeled LTC needs defined as a loss of ability to perform activities of daily living such as eating and bathing. So the difference in first-year needs can be easily explained.
The green and darker green bars are estimates of the total duration of any LTC need over the course of retirement. Both are based on complex microsimulation modeling that projects health and other transitions for a large sample of individuals representative of the U.S. population. Again the differences in projected outcomes are definitional. Kemper’s LTC need includes individuals not able to perform at least one of the six activities of daily living (ADLs), while the HHS study is based on the loss of at least two ADLs and/or significant cognitive impairment. The HHS definition lines up closely with LTC insurance claim criteria.
The orange bars are my estimates from the SOA basic table models. Although HHS and JAT/SOA are using the same definition of LTC need, there are the following differences:
- JAT/SOA is for lives that have gone through underwriting, whereas HHS represents the entire U.S. population.
- JAT/SOA refers to claim durations beyond an initial elimination period akin to a deductible (typically 90 days).
- JAT/SOA is based on individual LTC claims and does not follow individuals over their lifetime.
The main difference in JAT/SOA versus HHS is in two- to five-year versus longer than five-year durations. This might be partially explained by the above three factors, but also these are estimates based on a myriad of assumptions; there are no perfectly correct numbers. There is additional uncertainty in that these estimates are based on recent history, while what matters for your clients are their projected LTC needs that may be 30 or more years in the future.
In the sections that follow, where I estimate LTC claim payments, I’ll use the projections I developed from the SOA material.
Gender differences
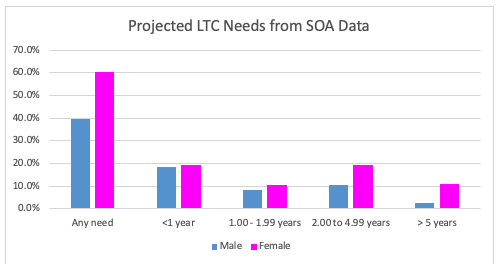
In the early days of the LTC insurance business, the same pricing was applied to both men and women. LTC insurers differentiated the pricing, and after one or two insurers priced men distinctly from women, the rest of the industry were essentially forced to follow or face severe anti-selection bias by women choosing much lower, uni-sex rates. The chart below splits the SOA data into men and women.
The significant differences in both incidence (any need) and claim duration are apparent from the chart, and I will use these projections in comparing LTC pricing for men and women.
Pricing comparisons
The American Association for Long-Term Care Insurance (AALTCI) provides a wealth of information on its website about LTC insurance, and its executive director, Jesse Slome, was very helpful in providing policy pricing information. In particular, he provided pricing I utilized to compare financial outcomes for:
- Men versus women
- Three-year versus five-year benefit period
- Traditional LTC versus a life/LTC hybrid
I used the SOA basic table models for claim incidence, terminations (to measure claim duration), and utilization (percent of maximum benefit claimed) to develop projected financial outcomes. All LTC insurance policies were assumed to be purchased at age 55. Claim probabilities for men and women were as depicted in the above chart with 40% of men and 60% of women expected to reach claim-eligibility status after a 90-day elimination period. (So under these assumptions, 60% of men and 40% of women pay premiums, but never file a claim.) Assumed claim ages were 88 for men and 89 for women. Policies were assumed to have a provision that grows the initial monthly benefit at a 3% compound rate for the life of the policy. The monthly benefit times the benefit period (for example, three or five years) is known as the benefit pool. If claims on a policy are less than the monthly benefit maximum, the claim may extend beyond the end of the benefit period, so the benefit pool is the most important determinant of when a policy has exhausted the available benefits.
There is a lot of flexibility and interpretation in working with the SOA models and the particular modeling used represents my preferences.
Gender comparison
The chart below compares traditional LTC policies (premiums and claims only, no ancillary benefits like life insurance) issued to 55-year-old men and women. The policies both have a three-year benefit period and an initial monthly benefit of $4,556. The premium for a man is $1,700 per year and $2,675 for a woman, and these are average premiums AALTCI obtains from multiple carriers. The benefit pool grows to $434,983 for men at assumed claim age 88 and slightly higher for women one year later.
These comparisons of financial outcomes all assume that premiums remain level for the full life of the policies, but it well known that LTC policies have seen substantial rate increases. There are reasons to be optimistic that new policies will not undergo this experience, and I address this issue later in this article.
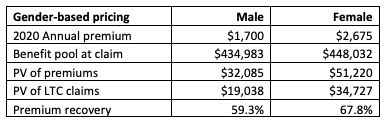
The performance measure I utilized is a ratio of the present value of premiums paid to claims paid, expressed as recovering a portion of the premium. It helps to think in present value terms because LTC claims may not occur until 30 or more years after policy issue. The interest rate used in the present value calculation can be thought of as the client’s opportunity cost of giving up investing dollars to purchase insurance. The rate might range from a nominal 2% for the most conservative investing to double digits for the most aggressive. I chose 4% nominal as a compromise.
The chart above shows that premiums for women are substantially higher than for men, and the premium recovery percentages are an indication that LTC insurance involves substantial loads paid to the insurer. Roth made the point in his article that one does not expect to make money when buying insurance. LTC insurers need to cover sales and administrative costs, and build in a margin for risk and profit. The premium recovery percentages indicate that women get a somewhat better deal on the insurance than men despite the higher premiums, but more testing would be needed to prove this. Differences in recovery percentages may also reflect insurers utilizing profit measures different from loss ratios in their pricing objectives, such as the return on statutory capital.
Benefit period comparison
The chart below compares policies issued to 55-year old women with different benefit periods – three-year and five-year, and both have an initial monthly benefit of $4,500. Therefore, the five-year policy has a larger benefit pool, both initially and at the age 89 assumed claim age. Naturally, the premium is higher for the five-year benefit period. These policies are from a single insurer that sells both these benefit periods, whereas the previous chart was based on industry averages.
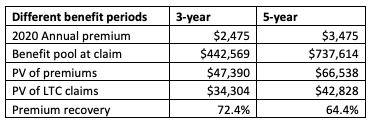
The three-year benefit period policy appears to be priced more attractively for the purchaser, but again my cautions above apply. In choosing a benefit period (and benefit pool), an important consideration is tail risk. For women, there is about a 10% probability of claim status (disability) lasting longer than five years, so a three-year benefit period certainly wins on cost, but may leave substantial tail risk.
Traditional versus hybrid
Hybrid policies that combine life insurance and LTC have become more popular than the traditional LTC version. These hybrids are offered both as single-premium policies and with recurring premiums similar to traditional. Single-premium versions remove the risk of future premium increases. Hybrids are also attractive because they eliminate the significant probability of paying premiums for years and getting nothing back if there is no LTC claim, but of course, these hybrid policies are more costly.
This is a comparison of a traditional and hybrid policy issued to 55-year-old females where both have annual premiums. They are both set up with a three-year benefit period, an initial monthly benefit of $5,000, and 3% compounding. The hybrid carries a life insurance benefit of $130,000, and any LTC claims first reduce this life insurance benefit, so a substantial LTC claim effectively turns the policy into LTC-only with no separate life insurance claim payment. The traditional policy has a 90-day elimination period, whereas the hybrid pays claims from day one.
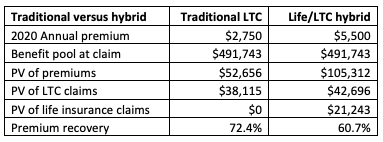
Not surprisingly, the hybrid policy is significantly more expensive. The buyer might expect to get back more on the traditional policy, but again caution is called for in reaching such a conclusion. In particular, hybrids offer living benefits such as return of premium for lapses that are not captured in this analysis.
Payments by claim duration
The chart below shows the expected payments by claim duration for three policies we have examined before, all issued to a 55-year-old woman – traditional LTC with three-year and five-year benefit periods, and a hybrid life/LTC policy. The projected claim payments are shown as present values in relation to the present value of premiums on the three policies (shown in parenthesis at the bottom of the chart) in order to facilitate comparisons. An example for how to read the chart is that for traditional LTC with a five-year benefit period, the present value of expected payments for claims that lasted between four and five years is 200% of the $66,538 expected present value of premiums for such policies.
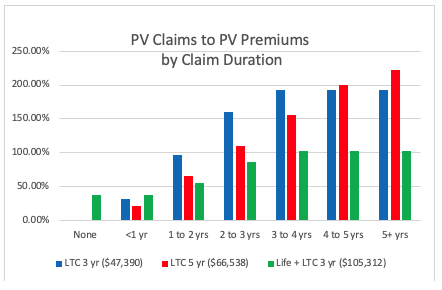
As we would expect from the previous analysis, the three-year benefit period does well for claims up to three years, but then levels off, and extending the benefit period to five-years provides more spread of the claim risk. The hybrid life/LTC policy does indeed provide a return of some funds if there is no claim, and this particular policy would be expected to give back about half of the present value of premiums paid. Hybrids also provide living benefits mentioned earlier that are not incorporated in this chart.
Future premium increases
LTC insurance has a well-known history of substantial premium increases on existing policies, even though such increases have required approval from state insurance departments. Over the past two decades, periodic increases in annual premiums have ranged from 20% to 100% – a grim picture overall. Today, many advisors hold the view that LTC insurance is not worth considering because insurers will keep raising the premiums, creating financial hardship for clients and embarrassment for advisors. Single-premium hybrid policies alleviate this risk, but there could still be concern about other adjustments insurers might be allowed to make if such policies become unprofitable.
However, instead of writing off consideration of LTC insurance, one should examine the prospects for future premium increases. This 2016 study, authored by Robert Eaton (a principal and consulting actuary with Milliman, Inc., in Tampa, FL), summarized the work of an actuarial project team that examined premium increases for new business, and found reasons to be more optimistic about premiums remaining stable. For example, LTC insurance is now being priced with substantially greater risk margins than on earlier product versions, and interest rate and lapse assumptions have been brought into line with current experience. Also, insurance companies now have much more data about claims experience and trends than in the earlier days when the pricing actuaries worked with limited data sources. For advisors who want to carefully consider the prospects for rate increases, this paper is worth reading.
Final thoughts
I have not presented a conclusion in this article, either for or against the purchase of LTC insurance. This is an individual matter that depends on the product structure most appropriate for particular clients, the pricing and the client’s view on risks. An area for future research could be tools to help advisors work with clients in decisions about LTC insurance.
There has been some discussion in the advisor community, including APViewpoint posts for Roth’s article, about desirable changes to LTC product design. For example, some advisors would like to see a catastrophic product with a two- or three-year elimination period to insure against tail risk. The actuaries who design products are interested in ideas and my hope is that this article will generate further APViewpoint discussion and provide useful product-design input.
Joe Tomlinson is an actuary and financial planner, and his work mostly focuses on research related to retirement planning. He previously ran Tomlinson Financial Planning, LLC in Greenville, Maine, but now resides in West Yorkshire, England.
Membership required
Membership is now required to use this feature. To learn more:
View Membership BenefitsSponsored Content
Upcoming Virtual Events View All


