The recent poor performance of value funds has led some investors to illogically shift to products with less exposure to the value factor. The evidence that the value factor has worked over long periods of time means you want more exposure to it, not less.
Over the period 2017 through March 2020, the value premium, as measured by the traditional metric of HML (the return of stocks with high book-to-market minus the return of stocks with low book-to-market), experienced a drawdown of 42%.[1] Other commonly used value metrics such as price-to-earnings and price-to-cash flow experienced similar drawdowns. The result was that when investors in systematic (quantitative) value funds received their quarterly statements in April 2020, they would have noticed that those funds with greater exposure to the value premium than their benchmark index had underperformed for the prior 10 years. This has led many to conclude that something must be wrong with their funds. I will explore why this is a common error that can cause investors to abandon even well-thought-out plans.
I will begin by explaining that not all “passively” managed funds (no individual stock selection or market timing) are created equal. Index-based mutual funds and index-based exchange-traded funds (ETFs) seek to track an underlying securities index and achieve returns that closely correspond to the returns of that index (generally with low fees). However, not all passively managed funds are index funds. There are funds that invest systematically and transparently (passively) in value strategies that do not try to match any index. They create their own fund construction rules, defining their eligible universe with the goal of achieving a certain degree of exposure to common factors such as value, size, momentum, profitability and quality. Since different systematic funds can have different eligible universes, they can perform very differently, even though they may be in the same asset class (such as U.S. small value).
If the funds are truly systematic in implementing their strategy, each will be doing exactly what it is supposed to be doing, yet their returns can be very different. Those differences in returns do not mean that one fund is necessarily better than the other. The differences will be reflected in exposure to the factors that explain returns. While all index funds are commodities (the only difference between two funds matching the same index is likely to be the fund fees), not all systematic funds are commodities. The following simplistic example illustrates this point (data from Morningstar as of March 31, 2020).
The Russell 2000 Value Index is a common benchmark for U.S. small-value funds. The largest ETF based on that index is the iShares Russell 2000 Value ETF (IWN). Dimensional Fund Advisors U.S. Small Cap Value Fund (DFSVX) is the longest running systematic small-value fund that does not track a published index. Examining the holdings of the two funds, you can see how different they are in terms of their exposure to the value factor. While the two funds had similar average market caps (IWN at $1.3 billion and DFSVX at $1.5 billion), the average price-to-earnings (P/E) of IWN was 13.6 versus just 8.5 for DFSVX – the P/E of IWN was 60% higher than that of DFSVX. In terms of price-to-book (P/B), IWN was 0.91 versus 0.68 for DFSVX – the P/B of IWN was 34% higher. In other words, DFSVX was much more “valuey.” Thus, if the ex-post value (realized) premium is negative, you should expect IWN to outperform DFSVX because it has less exposure to a factor with a negative premium. In other words, knowing that the value premium was negative over the last 10 years, we should expect IWN to have outperformed, which it did. Using the backtest tool at Portfolio Visualizer, we see that from April 2010 through March 2020, IWN returned 4.6% per annum versus 4.2% per annum for DFSVX.
Now let’s think about this from an ex-ante perspective – before we know the outcome. In a recent presentation, Gerard O’Reilly, Dimensional’s CIO, showed that value has outperformed growth over 10-year periods 83% of the time. Since IWN’s market cap is about 15% less than that of DFSVX while its P/E is about 60% higher and its P/B is about 34% higher, and the size premium (1.7%) has been about half that of the value premium (3.3%), if you believed in the small and value premiums and wanted to increase the odds in your favor, you should have chosen to invest in DFSVX over IWN. On the other hand, if you did not believe in the premiums, you should not have invested in either, limiting your exposure to a total market fund (i.e., why invest in factors you expect to underperform and also pay a higher fee?). The fact that the risk of value showed up should not have been unexpected, as it had happened 17% of the time over previous 10-year periods.
The same logic applies going forward. If you believe in the size and value premiums, you should prefer DFSVX over IWN. If you don’t, you should not invest in either.
DFSVX underperformed a benchmark that is mis-specified, making it challenging to judge relative performance. The fund delivered the factor exposures it said it would deliver and investors, thus, should have been expecting. And it continues to do so. There are many other small-value funds, each with their own exposures to these factors. Investors should choose the factors they want exposure to and then find the fund that provides the most expected return for a unit of cost – not just the cheapest fund, because not all small-value funds are created equal. They are not commodities. Expense ratios are important considerations, but they should not be the only determinant, or even the dominant one.
Factor exposure explains most of the variation in returns
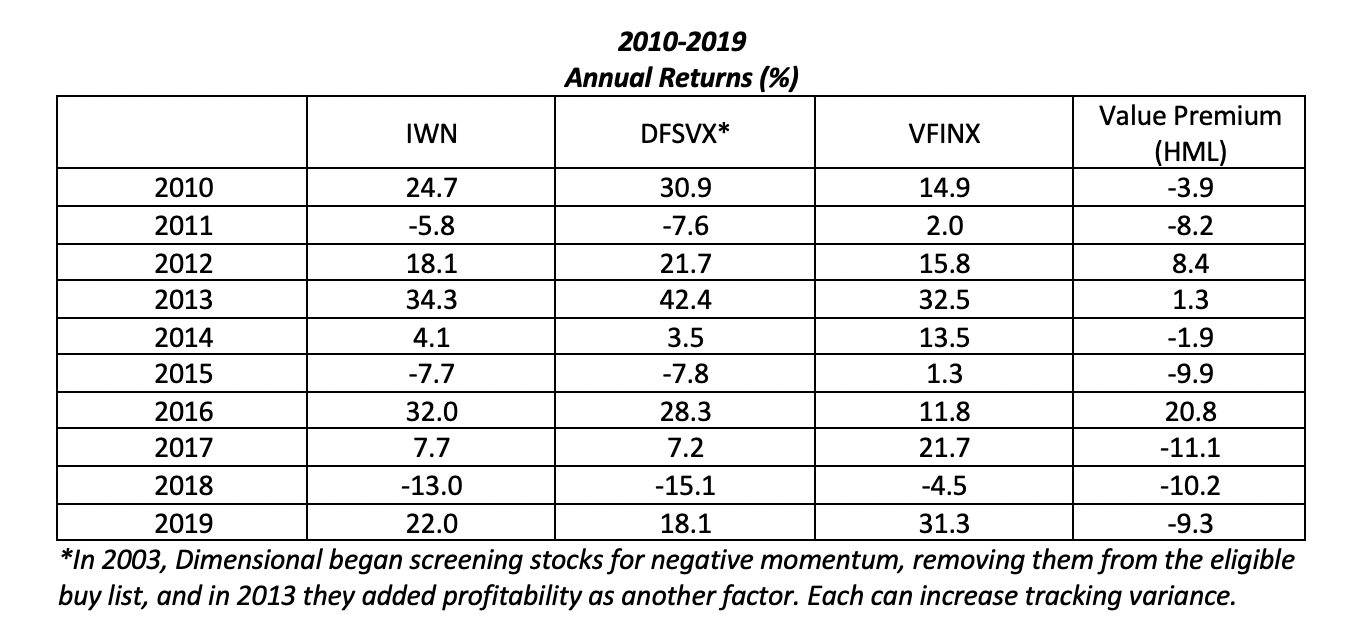
The following table, using the backtest tool at Portfolio Visualizer, provides further insight into the performance of the two similar, but not equal, small-value funds. When the value premium was negative, the S&P 500 Index Fund (VFINX) tended to outperform both IWN and DFSVX, and IWN tended to outperform DFSVX. When the value premium was positive, the reverse tended to occur. The one significant exception was in 2010. While the value premium was -3.9%, the size premium was +13.1%. That explains why the smaller IWN and DFSVX outperformed VFINX. The other exception occurred in 2016 when the value premium was positive – while the two small-value funds did outperform VFINX, IWN outperformed DFSVX. With only one major exception, this shows the power of asset pricing models in explaining returns.

We would see very similar results if we examined the performance of Dimensional’s international value funds versus their benchmarks. The explanation is simple: The value premium was negative across most countries and regions over this period. Each of the Dimensional international value funds underperformed their benchmark indexes over the last 10 years, though by relatively small amounts. In other words, the funds accomplished their objective of providing greater exposure to the value factor in a systematic and transparent way.
You should be cautious when comparing their funds to a generic benchmark index. One reason is that indexes don’t have expenses; thus, you should use a live fund. The more important reason to not compare their performance to a benchmark index fund is that if you wanted the exposure provided by the index fund, you would choose it, not the Dimensional fund. The reason you chose the Dimensional Fund is that you wanted more exposure to common factors than provided by the index fund – and the fund provided those exposures in a transparent and systematic way. You may not be happy with the results, but changing horses because the funds underperformed their benchmark is making the mistake known as “resulting.”
Are you guilty of resulting?
One of the more common mistakes both individual and institutional investors make is the tendency to equate the quality of a decision with the quality of its outcome, or what poker players call “resulting.” Nassim Nicholas Taleb, author of “Fooled by Randomness,” provided this insight into the right way to think about outcomes: “One cannot judge a performance in any given field by the results, but by the costs of the alternative (i.e., if history played out in a different way). Such substitute courses of events are called alternative histories. Clearly the quality of a decision cannot be solely judged based on its outcome, but such a point seems to be voiced only by people who fail (those who succeed attribute their success to the quality of their decision).”
In my book, Investment Mistakes Even Smart Investors Make and How to Avoid Them, I called this mistake, “confusing before-the-fact strategy with after-the-fact outcome.” The mistake is often caused by “hindsight bias”: the tendency, after an outcome is known, to see it as virtually inevitable. As John Stepek, author of The Sceptical Investor, advised, “To avoid such mistakes, you must accept that you can neither know the future, nor control it. Thus, the key to investing well is to make good decisions in the face of uncertainty, based on a strong understanding of your goals and a strong understanding of the tools available to help you achieve those goals. A single good decision can lead to a bad outcome. And a single bad decision may lead to a good outcome. But the making of many good decisions, over time, should compound into a better outcome than making a series of bad decisions. Making good decisions is mostly about putting distance between your gut and your investment choices.”
Good decisions can lead to bad outcomes
In his 2001 Harvard commencement address, Robert Rubin, former co-chairman of the board at Goldman Sachs and Secretary of the Treasury during the Clinton administration, addressed the issue of resulting. He explained: “Individual decisions can be badly thought through, and yet be successful, or exceedingly well thought through, but be unsuccessful, because the recognized possibility of failure in fact occurs. But over time, more thoughtful decision-making will lead to better results, and more thoughtful decision-making can be encouraged by evaluating decisions on how well they were made rather than on outcome.”
Unfortunately, as Ken Fisher and Meir Statman noted in their 1992 paper, A Behavioral Framework for Time Diversification, “Three years of losses often turn investors with thirty-year horizons into investors with three-year horizons: they want out.” Because investors don’t know investment history, they fail to understand that when it comes to risky assets, three-, five- and even 10-year returns can be nothing more than noise. That leads to the mistake of recency, which in turn leads investors to buy after periods of strong performance – when valuations are higher and expected returns are now lower – and sell after periods of poor performance – when prices are lower and expected returns are now higher. This is the opposite of what a disciplined investor should be doing: rebalancing to maintain their portfolio’s asset allocation.
Summary
Judging a systematic fund against a generic benchmark index, or even a benchmark index fund, is not a logical decision. You have to make sure you are measuring performance against appropriate risk-adjusted benchmarks, accounting for exposure to the factors that explain the variation in returns of diversified portfolios (such as market beta, size, value, momentum, profitability/quality, and so on). Doing so will help to determine if the fund is adhering to its strategy and executing it well, minimizing trading costs. Otherwise, you might be comparing apples to oranges – and make the mistake of resulting.
While you don’t need to wait three, five or 10 years to judge the performance of an athlete or a team, when it comes to investing in risk assets, 10 years is very likely to be noise. This is why you should only invest in factors/asset classes that have very long track records of a premium that has been persistent across economic regimes and long periods of time; pervasive across industries, countries, regions and even asset classes; robust to various definitions; survives transactions costs; and has intuitive risk- or behavioral-based explanations for why you believe the premium will persist. These are the criteria presented in my book, co-authored with Andrew Berkin, Your Complete Guide to Factor-Based Investing.
Larry Swedroe is the chief research officer for Buckingham Strategic Wealth and Buckingham Strategic Partners.
Important Disclosure: Indices are not available for direct investment. Their performance does not reflect the expenses associated with the management of actual portfolios nor do indices represent results of actual trading. Information from sources deemed reliable, but its accuracy cannot be guaranteed. Performance is historical and does not guarantee future results. Total return includes reinvestment of dividends and capital gains. In addition, my firm recommends Dimensional Fund Advisors funds to clients.
By clicking on any of the links above, you acknowledge that they are solely for your convenience, and do not necessarily imply any affiliations, sponsorships, endorsements or representations whatsoever by us regarding third-party Web sites. We are not responsible for the content, availability or privacy policies of these sites, and shall not be responsible or liable for any information, opinions, advice, products or services available on or through them.
The opinions expressed by featured authors are their own and may not accurately reflect those of Buckingham Strategic Wealth®. This article is for general information only and is not intended to serve as specific financial, accounting or tax advice.
© 2020, Buckingham Strategic Wealth®
[1] If we extend the period back to January 2007, the drawdown of about 51% is the largest ever. In addition, when looking at the value factor itself based on the univariate sort, the numbers remained consistent with a drawdown of 47% from January 2017 through March 2020, and a drawdown of 59% from January 2007 through March 2020. We also found that using the univariate sort, high book-to-market stocks lost 22.7% in total returns from January 2017 through March 2020. Low book-to-market stocks returned 49.1% in total returns over the same period, for a relative underperformance of 71.8%. From January 2007, high book-to-market returned 32.4% (total return) versus 246% for low book-to-market, for a relative underperformance of 213.6%.
More ETF Topics >