Advisor Perspectives welcomes guest contributions. The views presented here do not necessarily represent those of Advisor Perspectives.
Analysts have many ways to estimate expected market returns. The challenge is to identify those few that provide usable information for making investment decisions. In this article, I discuss one of the common mistakes made in this type of analysis and why the cyclically adjusted PE (CAPE), developed by Robert Shiller, is not nearly as reliable a predictor of market returns as most claim it to be.
CAPE
One of the best known of these measures is the CAPE. It is widely accepted as an indicator of market under- and over-valuation, no doubt due to its fundamental intuitive appeal. As an example of its wide acceptance, many market commentators are warning that the market is overvalued at the current CAPE of roughly 30 and thus are forecasting low returns.
For any such measure to be useful for making investment decisions, we first need to determine if it has been a reliable predictor of future market returns. As an example of this type of testing, a recent Advisor Perspectives (AP) article examined CAPE’s ability to predict 10-year stock market returns and found that its accuracy was “remarkable.” This anointed CAPE as an excellent candidate for making portfolio decisions.
Unfortunately, the author made the mistake of regressing 10-year overlapping returns on monthly values of CAPE to reach this conclusion. The misuse of overlapping returns is such a common and critical error that it is worth looking more closely at why it is mistakenly used so often, along with the problems it creates. Later in this article I will discuss how you can correctly use CAPE in making decisions.
The benefit mirage of overlapping observations
Since daily, monthly, and even yearly market returns are noisy, it is a challenge to uncover statistically and economically significant relationships that can help in decision making. This is particularly the case when trying to forecast long-term returns, as did the AP article. he short time period from 1995 through 2000 that was the focus of the article, there were only two non-overlapping 10-year periods, insufficient for a statistically significant test. A widely used solution to this problem is to calculate overlapping (or rolling) 10-year returns, which increases the number of observations from two to 180 in the sample. At first blush, this is a huge increase in statistical power.
But the improvement is a mirage.
The problem is that no new information has been added, since adjacent 10-year returns have 119 out of 120 monthly returns in common. This means that there are still only two completely independent, 10-year observations. The result is that statistical power, as captured by the number of independent observations, has not improved. The overlapping bias, which makes results look much stronger than they are, is well known and extensively documented (for example, see this paper). Unfortunately, it is a mistake still frequently made by practitioners and academics. Even Robert Shiller, the father of CAPE, fell prey to this error!
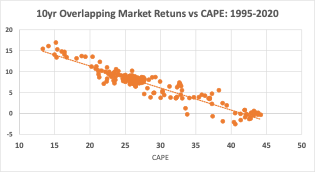
Returning to the AP article, overlapping 10-year returns were calculated using monthly market returns from 1995 through 2020, resulting in a CAPE return graph much like the one below (my calculations).
Sources: Robert Shiller and Kenneth French websites
The graph reveals a tight relationship between CAPE and market returns, something the article referred to as “remarkable.” The author further reported that CAPE explained an astounding 90% of return variability, with an average forecasting error of a mere 1.3% (as measured by a regression’s standard error). These are indeed impressive-sounding results and show the intuitive appeal of creating multiple overlapping observations when conducting such tests.
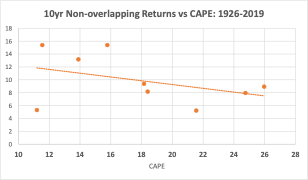
But unfortunately, the powerful results are largely the consequence of the misuse of overlapping returns. If instead, non-overlapping 10-year returns had been used, as is statistically sound, from 1926-2020 (1995-2020 is too short to conduct non-overlapping 10-year tests), the CAPE, return graph would look something like this:
Sources: Robert Shiller and Kenneth French websites
This more closely portrays the true CAPE-return relationship, which is not as neat and tidy as the previous one. Now less than half of return variability is explained by CAPE, while the prediction error has nearly quadrupled to 5.0%. This means that the frequently used forecast for next year’s return of 10% is generally within CAPE’s forecasting margin of error.
In turn, if we address the more interesting and practical question of forecasting the one-year market return, rather than the 10-year return, the forecasting error quadruples again to 19%! This clearly shows CAPE is a very noisy return predictor rather, than the remarkable forecasting tool claimed by the author.
Overlapping returns should be avoided when testing the accuracy of market-return predictors. There are several corrections that can be applied to overcome overlap bias, but they too have their own set of problems (see this paper). The simplest solution is to use only non-overlapping data when testing statistical and economic significance.
But not all is lost
Many will look at the large forecasting errors and decide that CAPE is not a useful predictor. However, an interesting result that weaves through the tests just discussed is that, in each case, CAPE is a statistically significant forecaster. There is useful information regarding future returns among all of that noise. The question is how to extract that information when making investment decisions.
My company, AthenaInvest, has developed a strategy built around a behavioral measure that is a noisy predictor of future returns, much as is CAPE. Our approach is based on what we call “market barometers” that measure expected market returns driven by investor responses to different investment strategies (see this AP article for more details).
Over the last 10 years, we have successfully managed a portfolio using market barometers for estimating expected market returns. For more information on how our global tactical portfolio is managed, visit us here.
Measures of market returns, such as CAPE and market barometers, are noisy but none-the-less useful tools for making investment decisions. It is important to develop a methodology in order to separate the signal from the noise when making decisions based on such measures. Unfortunately, using CAPE for portfolio management is not as easy as portrayed in the AP article referenced here. But it is as bad an error to reject such measures only because they are noisy predictors.
C. Thomas Howard is emeritus professor of finance at the University of Denver and CEO and chief investment officer at AthenaInvest, Inc.
More ETF Topics >
 Advisor Perspectives welcomes guest contributions. The views presented here do not necessarily represent those of Advisor Perspectives.