Bill Bengen’s research calculated how much a retiree can take out safely from a generic portfolio over 30 years without running out of money. Depending on the asset allocation, the safe withdrawal rate has variously been computed at 4% of the initial portfolio, with the dollar figure indexed for inflation thereafter, or 4.5% if the portfolio is more broadly diversified.
But wouldn’t it be nice if you could take a prospective client’s asset allocation and calculate the percent of time periods since 1926 that it would have survived a 30-year retirement?
You would be able to show a client who has a high percentage of fixed income that the odds are less than she might think. Better yet, you could vary the withdrawal rates, the length of the retirement, the asset allocation or the annual portfolio expenses, all right there on the screen, and see the odds of success change instantly as you change the key assumptions.
This is not a fantasy.
Enter the Big Picture, which lets you build and back-test portfolios using historical total-return data from 11 different asset classes since January 1926. While you’re playing with the variables, you can also define the rebalancing frequency and set a dollar figure on the legacy you want to leave to heirs.
Let’s say you create a balanced portfolio in the software which is 15% allocated to 5-year Government bonds, 15% to 10-year Government bonds, 10% to global bonds, 20% to large-cap stocks, 15% each to mid-cap and small-cap U.S. stocks, and 10% to international (ex-USA) stocks. You set the withdrawal rate at 4%, inflation-adjusted, and the program calculates that since 1926, this portfolio would have sustained that withdrawal rate over 30 years 100% of the time. Raise the retirement period to 40 years and you still have a 97% success rate, historically.
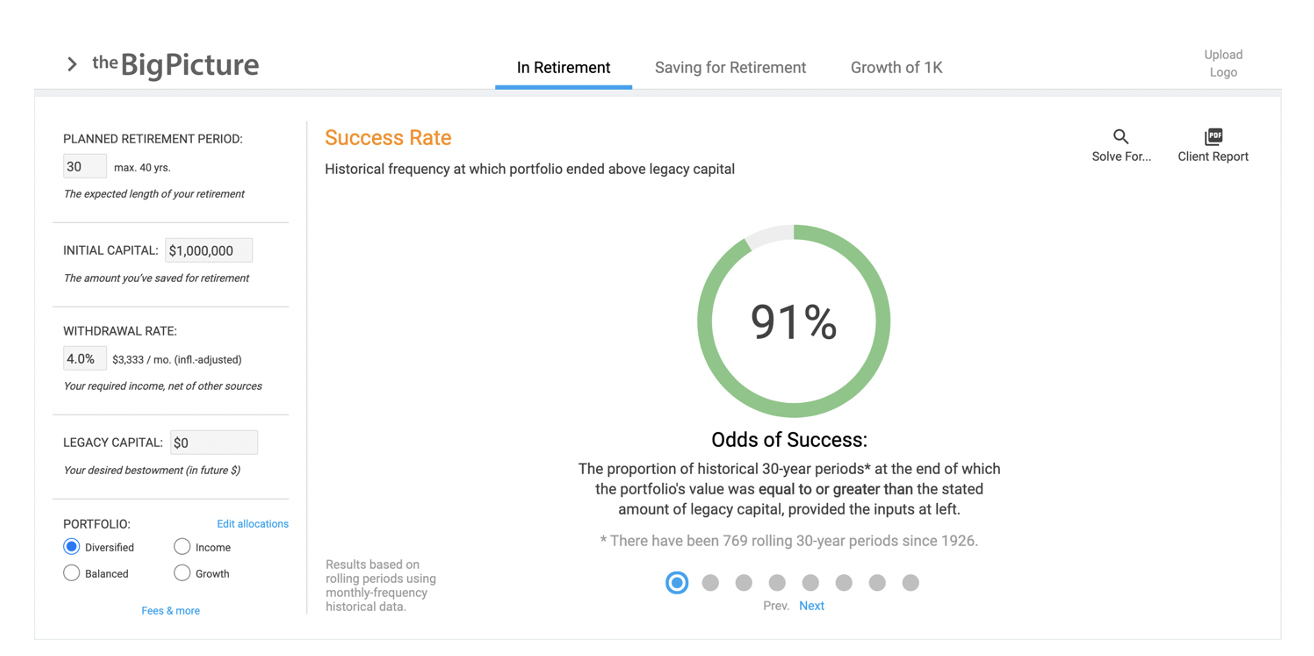
Below is the Big Picture’s base screen: Using historical performance information, and the advisor’s inputs, how often would a given portfolio meet the client’s spending goals?
This assumes an overall portfolio expense ratio of 0.5%. The Big Picture lets you explore the dramatic impact of fees: Change the total expense ratio to 1.1%, and the success rate of this portfolio drops to 84%.
The expense ratio variable helps explain why, no matter how hard I tried, I wasn’t always able to get the system to give me a 100% certainty reading at a 4% withdrawal rate. Isn’t that Bengen’s original “SafeMax” figure?
McLean responds that Bengen’s research didn’t factor in management and advisory fees. In addition, the data in the Big Picture is more granular than Bengen’s calculations were. “Bill began by looking at annual data, and later moved to quarterly,” says McLean. “This program has monthly-frequency data, so we’re looking at more rolling historical periods, capturing more retirement starting points. This yields slightly more robust results.”
Notably, a conservative portfolio that is mostly bonds looks safe on a year-by-year basis, but only provides a 42% success rate at a 4% distribution over 30 years. Clearly this is not the safest long-term path to a sustainable retirement.
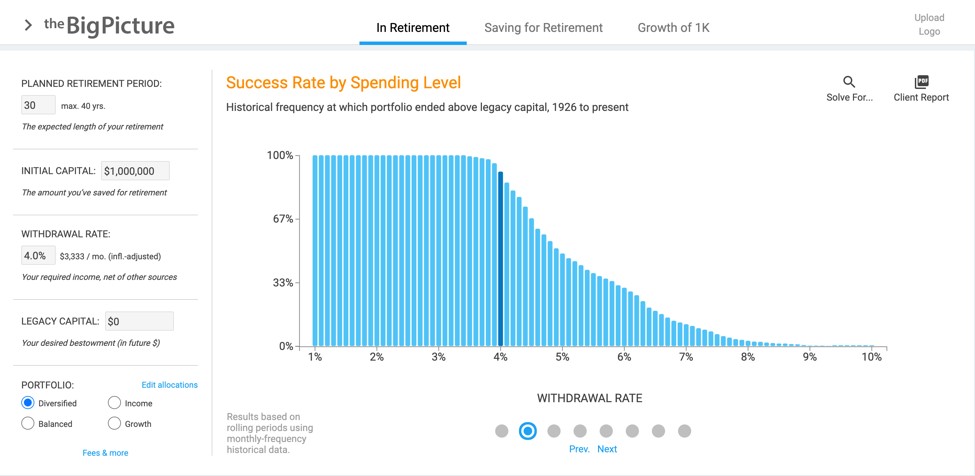
Below, the Big Picture shows the relationship between spending level and success rates for a given portfolio in retirement.
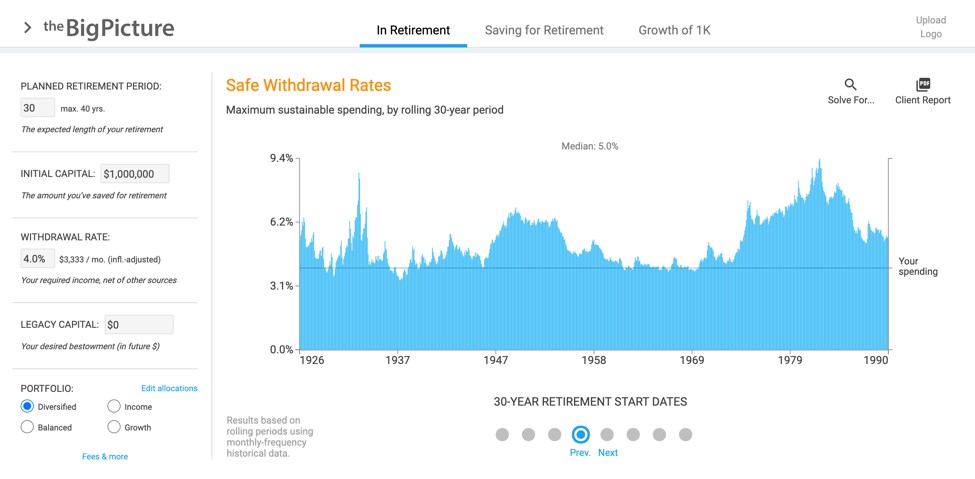
The software also has a chart that illustrates the maximum spending that a given portfolio was able to support in each rolling 30-year historical period. Because the program’s data are monthly in frequency, there have been nearly 800 such periods since 1926. Clients get a panoramic view of sequence-of-returns risk.
The Big Picture was created by Ryan McLean, a Canadian MBA who worked as a business and marketing consultant in Mexico City before taking a job as an analyst with Morningstar. He left to start a firm that creates investment performance charts you can hang on your wall, which display a great deal more information about different asset class returns than the Ibbotson charts that you’ve probably seen.
“The charts are used in banks and asset management companies throughout North America,” McLean explains. “We created the Big Picture as a living version of the print product.”
McLean points out that an advisor can create new customized portfolios that reflect a prospect’s actual allocation, and then let the prospect play with the inputs: a longer or shorter retirement period, a higher or lower portfolio distribution, a different expense ratio, etc. If the prospect or client prefers, the distribution percentage can be converted to dollar amounts, showing the monthly income the portfolio would be distributing.
This answers one of the questions that came to mind when I first played with the Big Picture: Why does it specify an initial investment? “There’s no reason if you’re just using a percentage distribution and you are indifferent to leaving a legacy,” McLean explains. “But when you consider the distribution in dollar terms, you also want to input the current value of the portfolio.”
The prospect can specify how much of a legacy he/she will leave to heirs: from $0 (‘I’m spending my kids’ inheritance…’) on up to any reasonable figure. The Big Picture software then calculate the chances that the portfolio will sustain the specified income (or percentage) and leave heirs with at least this much in the end.
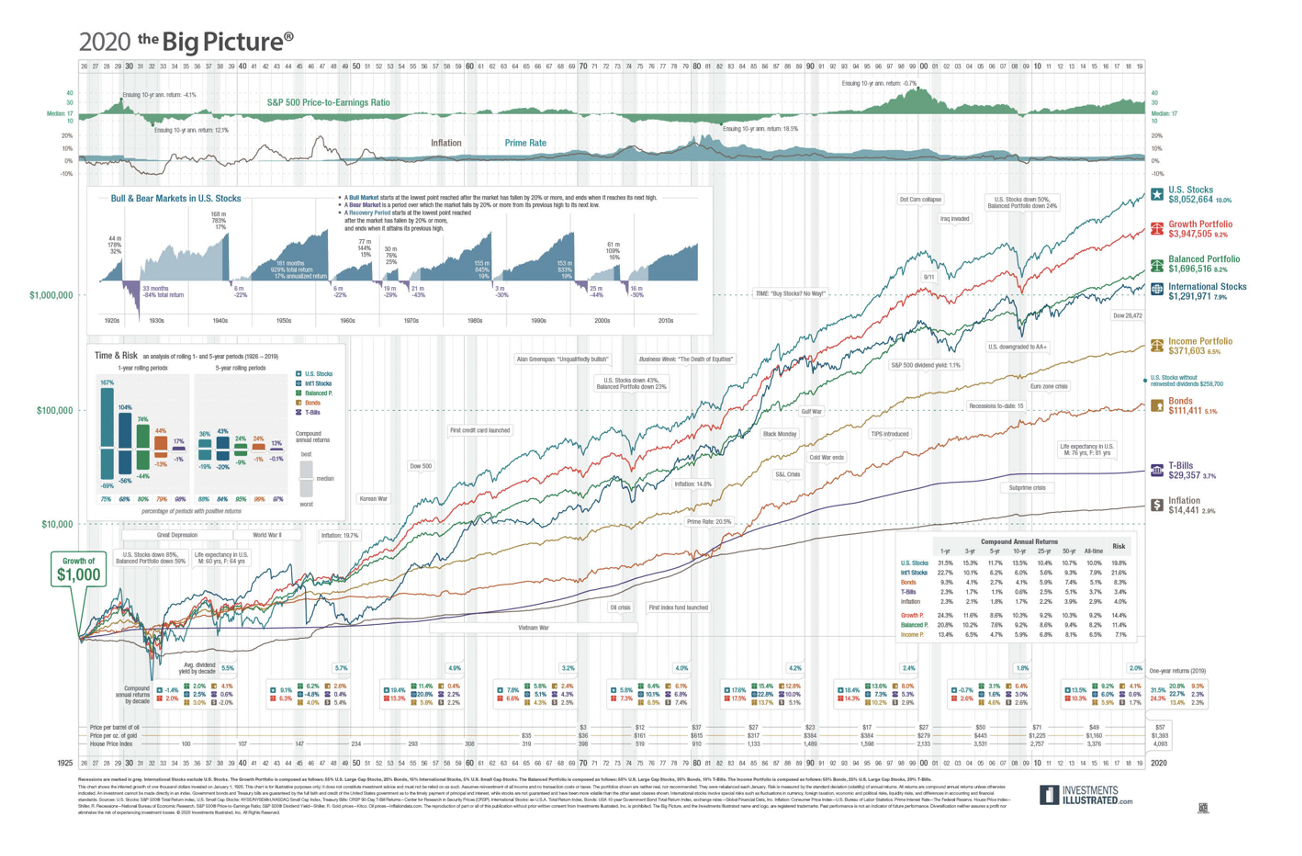
The Big Picture poster of market returns provides more information than the standard Ibbotson poster:
This is not a Monte Carlo tool that projects returns forward using different assumptions. The percentages are derived from historical rolling time periods – 30 years is the default, but it could be as low as a couple of years or as high as 40. That means the data behind the percentages is actual returns and inflation that were experienced by real people, with the expenses and distributions layered into the results.
The analysis carries the implicit assumption that historical data is predictive of future performance. If you believe, for example, that the sustained capital market returns will be lower than the historical data, you need to use other ways to analyze retirement results (or, as a workaround, raise the expense burden in the application to simulate a lower-return world). It also assumes a fixed withdrawal strategy. Some research shows that a variable withdrawal strategy can increase the probability of success (though research also shows that in some down markets such a strategy would entail massive reductions in spending, which may be unrealistic). There are tools that compare a client’s risk tolerance to a client’s portfolio – both MacroRisk Analytics and RiXtrema will map a portfolio to FinaMetrica’s risk-profile score.
But the Big Picture does something more fundamental: It helps clients see their actual chances of success if they make certain choices about distributions, portfolio design, expense ratios and legacy amounts.
McLean emphasized three enhancements that were recently built into the software. The first is a “Solve For” tool that allows advisors to set a confidence level (success rate) and then solve for a desired output. For example, “What is the maximum level of spending that a given portfolio supported over 30 years, at a 90% success rate?”
The second feature is multi-page reports, summarizing all of the application’s inputs and outputs, which can be emailed to clients directly from the program, or downloaded locally in PDF. The third is white-labeling; advisors can add their logo at the top-right of the interface.
I can picture a time when most financial planners and portfolio managers routinely use the Big Picture to explore portfolio choices with their clients – and that will be especially true for those who use low-cost investment options, since the tool illustrates that the cost factor causes the success rate to swing dramatically. The conversations with prospects will often include the prospect looking up from playing with the mouse and saying: “Why didn’t my other advisor tell me any of this?”
Cost? Subscribers pay $30 a month for the Big Picture, and as a bonus can get a discounted copy of the returns data poster.
To find out more about the Big Picture, click here.
Bob Veres' Inside Information service is the best practice management, marketing, client service resource for financial services professionals. Check out his blog at: www.bobveres.com. Or check out his Insider's Forum Conference at www.insidersforum.com.
More Portfolio Building Topics >