Advisor Perspectives welcomes guest contributions. The views presented here do not necessarily represent those of Advisor Perspectives.
Like Lazarus, the topic of inflation has risen from the dead. The increase in headline inflation to 4.2% in April 2021 was eyepopping and reinforces the fear that a continued surge in commodity prices, supply-demand imbalances from reopening, and fiscal stimulus will cause further price increases. Indeed, that fear is evident, as the 10-year breakeven inflation rate rose to 2.54% (as of May 12), which was in the top decile of its historical range since 2003.
With commodity prices accounting for about 36% of the Consumer Price Index (CPI) basket, investors naturally see it as the first line of defense in their asset allocation. Nonetheless, there are many other components that affect CPI, namely housing (where rent accounts for about 33% of the CPI), and transportation and medical care, which account for another 15% and 9%, respectively.[1] The diverse nature of the basket implies that there is more than one way to hedge inflation.
Moreover, investing in commodities is not always practical for a variety of reasons. Commodity futures include carry costs that reduce returns; commodity ETFs have high expense ratios and may necessitate K-1s, and sometimes, a client’s investment policy statement may not make room for the asset class.
Are there better ways to protect against inflation? We look at specific equity industries commonly available in ETFs as an alternative.
Equity industries as inflation hedges
Some equity industries should be good inflation hedges because surging prices will cause revenues to rise faster than costs, resulting in higher earnings. As such, we think of equity industry returns as comprising two components: a market beta that earns the equity-risk premium, and an idiosyncratic, industry-related component that can be correlated to inflation. Our goal is to separate the two investment decisions; i.e., without over/underweighting equities, can we change the composition of an equity portfolio to express our views?
We assessed a list of ETFs in different industries (55 names in total including GICS-sector ETFs) and regressed rolling-12-month excess returns of each ETF with two variables: the rolling 12-month excess returns of the S&P 500 and year-on-year headline inflation, over five and 10 years. The coefficient on the inflation variable told us how sensitive these industries were to headline inflation, after controlling for market beta. For comparison, we also included the iShares S&P GSCI Commodity-Indexed Trust (GSG) in our analysis.
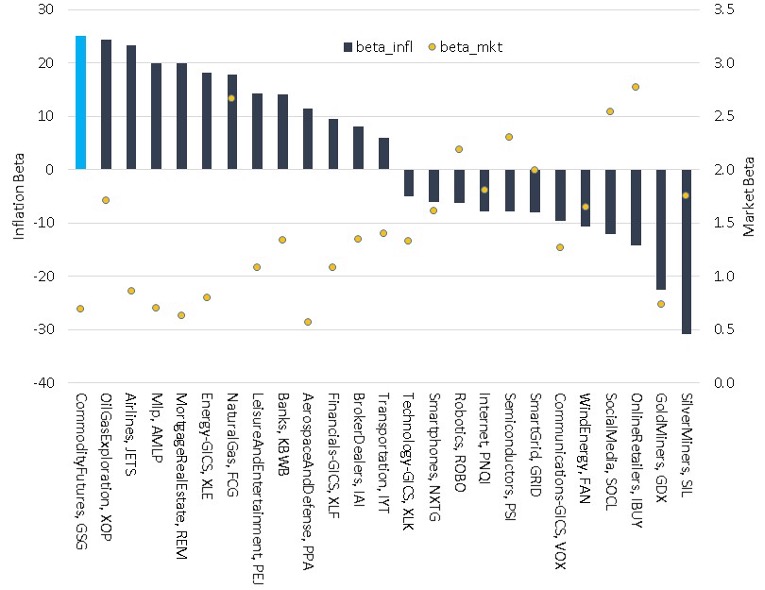
Display 1 shows the results over the past five years, with only statistically significant results shown. The results confirm that GSG was indeed highly correlated to headline inflation – in this case, a 25% rise in GSG corresponded to a 1% rise in headline inflation. Across equity industries, not surprisingly, commodity-related areas such as oil and gas exploration, master limited partnerships, and natural gas producers were good hedges – in fact, many of them were as effective as GSG, with similar inflation betas. Additionally, real estate, transportation, and financials, like banks, are on the list – this result is not surprising as some of these are material components of the CPI basket.
On the other hand, technology companies and precious metal producers were most adversely affected by inflation. A regression analysis like this does not tell us specifically why, and the interaction of the underlying economic factors could be more complex. For example, the linkage between precious metal producers or banks and, inflation is likely through interest rates. To the extent inflation drives rate expectations, the relationship between returns and inflation will endure. We should be aware of the limits of these relationships and apply fundamental analysis accordingly.
Display 1: Sensitivity of equity industries to headline inflation (Trailing 5-years ending Mar ‘21) *
Source: Matrix Private Capital Group; Date range: Mar 2016 – Mar 2021
*Note: Only statistically significant results are shown, using a 5% confidence interval with Newey-West adjusted standard errors because of overlapping data
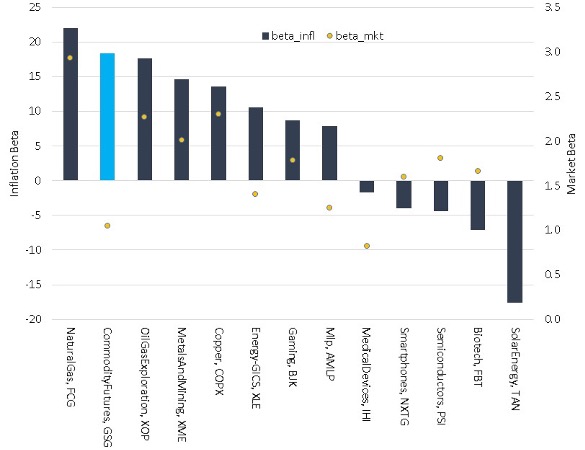
For completeness, we also included trailing 10-year results for the same analysis (the subset of ETFs to analyze dropped a bit to 51). Yet again, we see similar patterns: commodity producers were good inflation hedges, even better than GSG in one case, and more innovation-focused industries across healthcare, technology and energy, were more susceptible.
Display 2: Sensitivity of equity industries to headline inflation (Trailing 10-years ending Mar ‘21) *
Source: Matrix Private Capital Group; Date range: Mar 2011 – Mar 2021
*Note: Only statistically significant results are shown, using a 5% confidence interval with Newey-West adjusted standard errors because of overlapping data
Practical implementation
How should we use this information? As mentioned, to express tactical views, one can simply replace some broad equity market exposure with the industries above, being cognizant of market beta. As the S&P 500 has a zero-inflation beta over a five-year period, over/underweighting these industries will introduce sensitivity to inflation. From a risk-management perspective, the analysis provides an investor with a measure of the hidden risks lurking in a portfolio that holds stocks in these areas. In turn, he/she can add or reduce exposure where necessary to align the portfolio with specific data-backed views on inflation.
Ing-Chea Ang is the director of quantitative research and investments and Matthew Rubin is the chief investment officer at Matrix Private Capital Group, a New York-based investment manager.
By Matrix Private Capital Group, [email protected]
[1] Bureau of Labor Statistics: https://www.bls.gov/cpi/tables/relative-importance/2020.htm
Read more articles by Ing-Chea Ang, Matthew Rubin
 Advisor Perspectives welcomes guest contributions. The views presented here do not necessarily represent those of Advisor Perspectives.