Advisor Perspectives welcomes guest contributions. The views presented here do not necessarily represent those of Advisor Perspectives.
Most retirement planning software uses data or assumptions that will lead to unrealistically optimistic outcomes, considering our low-interest-rate environment.
Last month, I posted my latest co-authored research paper, A Case Study in Sequence Risk, on SSRN. As the title of this article alludes, our analysis led us to some disturbing conclusions. Since “fear sells,” our findings have attracted a modicum of attention in the financial news media, including Brett Arends’s March 12, 2021 MarketWatch article, ‘Worst-case scenario’ warning for retirees and the 4% rule.
Our paper examined the 20-year investment period that began with the bear markets of 2000-2002, which was followed by the 2007-2009 bear market. Despite the dramatic rebound and advance in the stock market over the ensuing decade, we found that the first two decades of the 21st century was among the worst 20-year periods in U.S. investment history. Specifically, consumers who retired at the beginning of that period and blindly followed the vaunted “4% rule” or even other better empirically supported static spending strategies are at considerable risk of running out of money well before they run out of time.
More ominously, especially for consumers approaching retirement, the 20-year period we examined does not represent a “worst-case” scenario. In fact, the strong performance of bonds, as interest rates fell during the study period, buffered total portfolio returns in a way that is not likely repeatable when starting a retirement spending regimen in the current historic low-interest-rate environment. Were we to experience similar back-to-back severe, prolonged stock market downturns with interest rates stuck at today’s low levels or, worse, while interest rates are rising, the result might be a true black swan event that could make a 3% inflation-adjusted withdrawal rate unsustainable for a 30-year retirement horizon.
We are neither alone nor first in reaching this conclusion. Michael Finke, Wade Pfau, and David Blanchett postulated just such a scenario in a 2013 Journal of Financial Planning paper, The 4% Rule is Not Safe in a Low-Yield World. For his part, David Blanchett has been warning about this possibility, as in the following excerpt from his August 2020 article for ThinkAdvisor –
I’ve done quite a bit of research on the implications of low bond yields (and likely low equity returns) with Michael Finke and Wade Pfau. As a result, I think it’s always important to remind advisors, retirees and pretty much anyone who will listen that most research on optimal retirement income strategies has been based on historical U.S. returns, and the historical yield on bonds has been way higher than it is now… Despite this fact, many financial advisors are still using historical long-term average values in financial plans. I think that’s beyond lazy, it’s almost malfeasance.
Per the findings presented in the epilogue of our SSRN paper, we echo Blanchett’s view on the critical importance of accounting for historic low interest rates when conducting portfolio sustainability analysis for consumers today. However, the fault for failing to make such an accounting lies as much with the software as with the advisors.
To support this position, I tested the “4% [safe-withdrawal rate] Rule” over a 30-year time horizon using Vanguard’s popular Retirement Nest Egg Calculator Monte Carlo simulation app, The Big Picture App’s historical back-testing program, eMoney’s Monte Carlo simulation software (using its default capital markets assumptions), and my own “home grown” Nest Egg Guru Retirement Spending App.[1] The latter applies bootstrapped simulations with resampling as its simulation engine using monthly market return data from 1970 to the present from the S&P 500, Russell 2000, and MSCI EAFE indices while holding bonds constant at a 2% return and cash constant at 0%. I used a hypothetical $1 million initial retirement savings portfolio invested in a classic 60% stock, 20% bond, 20% cash allocation model. All four models assumed an initial $40,000 withdrawal amount adjusted annually for inflation. The table below summarizes the results[2].
Table 1. Testing the 4% rule across four simulation apps
| |
Vanguard Nest Egg Retirement Calculator
|
The Big Picture App
|
eMoney
Monte Carlo Analysis
|
Nest Egg Guru Retirement Spending App
|
|
Percentage of Simulations that Lasted 30 years.
|
90%
|
98%
|
100%
|
71%
|
The successful simulation percentage result in Nest Egg Guru is far less encouraging than the results from the other three applications. The reason for this difference is simple – the first three apps in the table are using bond yields (either assumptions or historical data) that are, as Blanchett noted, “way higher” than what consumers can hope to earn today.
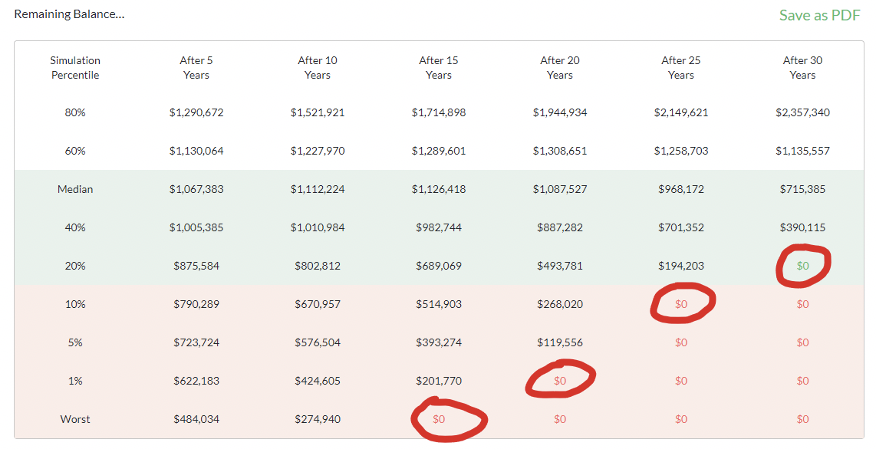
To make the impact of this 29% shortfall percentage from the Nest Egg Guru simulation more tangible and quantifiable, the complete remaining balance data from Nest Egg Guru’s output is presented in five-year increments across the 30-year time horizon in Table 2. As you can see, 30-year portfolio sustainability for investors today is far from assured under the 4% rule.
Table 2. Remaining balance data from Nest Egg Guru’s simulation testing of the 4% rule
To place the results in table 2 into historical context, the remaining balance after 20 years based upon a 4% withdrawal rate using a nearly identical 60/20/20 portfolio allocation using actual monthly market return data with a constant allocation glidepath and a 3% annual inflation adjustment in our Case Study in Sequence Risk paper was $224,852. This result falls just shy of $268,020 remaining balance for the 20-year (bottom) 10% simulation result (500th out of 5,000 sims). Within this context, the bottom 1% and 5% simulation results from Nest Egg Guru reasonably realistically reflect the shortfall risk retirees face if stock market conditions akin to the 2000-2009 period are paired with ultra-low bond returns instead of with a bull market for bonds.
Implications for the state of retirement spending guidance
The most important question clients want answered when they run retirement spending software is, “If things go badly in the investment markets, will I still be okay?”
While optimism may be a wonderful quality, it is a liability in a retirement spending app. Most retirement spending simulation software marketed to consumers, including the Vanguard Retirement Nest Egg Calculator, is grossly overly optimistic in terms of its bond return assumptions.
On the advisory side, it is a mixed bag. While applications that apply historical back-testing are obviously limited in their ability to adapt to today’s reality, most popular Monte Carlo-based applications, such as Money Guide Pro and eMoney, allow advisors to tinker with the internal capital markets assumptions. In fact, changing the capital markets assumptions for intermediate bonds and cash equivalents in eMoney’s Monte Carlo simulation program to match the bond and cash return assumptions in Nest Egg Guru’s bootstrapping simulation program produces nearly identical successful simulation percentages (70% for eMoney vs. 71% for Nest Egg Guru).
On the research side, while I applaud the ongoing effort of Finke, Pfau, and Blanchett to raise awareness of the unique risks retirees are facing, I take umbrage at their occasional patronizing rebukes of financial advisors. Of course, there is likely some contingent of the financial planning/wealth management community that is either unaware that the default expected return and standard deviation assumptions in most simulation software may be unrealistically high or that may not have had the academic exposure to econometrics and statistics necessary to understand the limitations of the software.[3] However, suggesting that mainstream financial advisors are committing “malfeasance” by following decades of albeit dated/flawed academic research (including some of these author’s own earlier contributions to the research pile) can hardly be characterized as criminal.
Similarly, in a February 2021 Plan Adivser interview discussing the problem that low interest rates pose for retirement portfolio sustainability, Finke commented that there is “a tremendous disconnect between academics and practitioners when it comes to annuities. We [academics] all know that annuities are the best tool to safely fund a retirement. Advisers must consider using this tool if they are to do their job properly.”
I view Finke’s “statement of fact” about annuities being “the best tool” with dismay and derision. While there is plenty of research challenging the wisdom and viability of static retirement distribution strategies such as the vaunted 4% rule (including our own Case Study in Sequence Risk findings), it is a huge and unjustified leap to conclude that annuities are therefore the optimal solution.
Intuitively, the irrevocable decision to transfer a significant portion of one’s life savings to an insurance company in exchange for a guaranteed income stream that will likely provide a lifetime internal rate of return close to 0% to hedge against a relatively low probability black swan event is not the no-brainer solution Finke makes it out to be. At the very least, more research is needed to quantify the sacrifice in income/legacy consumers may be making in choosing to annuitize in the more likely event that future investment environments are even modestly less extreme than the feared “worst-case scenario.”
At the same time, there is a promising nascent line of research that has begun to explore the benefits of dynamic distributions strategies. While dynamic distribution strategies often require a willingness on the part of the retiree to curtail spending and/or delay cost of living adjustments during depressed market environments, such unpleasantries may provide for greater total lifetime income and legacy than both static and annuitization distribution strategies. Although the seed for dynamic retirement distribution strategies was planted in Jonathan Guyton’s two widely cited papers in the 2000s, retirement researcher Derek Tharpe advanced this concept admirably in his 2017 Nerd’s Eye View article Dynamic Retirement Spending with Small-But-Permanent Cuts and in his March 2021 column Using Probabiltiy-of Success-Driven Guardrails in Retirement. His research mirrors the contributions of up-and-coming software-maker Income Lab, which offers financial advisors an algorithmic solution for practical implementation of a dynamic distribution guardrail strategy.
As much as I disagree with the tone and tenor of some of Blanchett and Finke’s public sermonizing, I applaud their prolific research contributions and efforts to warn about outdated spending paradigms. Our own latest research effort concurs with their general view that consumers who are retiring in the 2020s should indeed be afraid. Very afraid.
John H. Robinson is the owner/founder of Financial Planning Hawaii and a co-founder of software-maker Nest Egg Guru.
[1] The original program for Nest Egg Guru’s Retirement Spending app is written in MATLAB.
[2] Although a concerted effort has been made to make these cross-app comparisons as close to apples-to-apples as possible, subtle differences in assumptions exist. For instance, both the Vanguard app and the Big Picture app assume annual inflation adjustments that match the published CPI, while the Nest Egg Guru and eMoney analyses assume a consistent annual 3% C.O.L.A. Additionally, The Big Picture App, eMoney, and Nest Egg Guru illustrations assume a 1% total internal expense ratio, while Vanguard’s Retirement Nest Egg Calculator makes no accounting for investment expenses. Other subtle differences in the assumptions between the apps exist as well, but it is the author’s assertion that these differences do not materially alter the conclusions. Complete simulation results from all four applications are available upon request.
[3] At present, no academic background in finance, accounting, or economics is required to become a financial planner (“Certified” or otherwise).
Read more articles by John H. Robinson
 Advisor Perspectives welcomes guest contributions. The views presented here do not necessarily represent those of Advisor Perspectives.