Pay Attention to Marginal Tax Rates and Not Tax Brackets
Membership required
Membership is now required to use this feature. To learn more:
View Membership Benefits
Advisor Perspectives welcomes guest contributions. The views presented here do not necessarily represent those of Advisor Perspectives.
As an author of over 200 journal articles, several books, and a leading scholar on tax-efficient withdrawal strategies in retirement, I want to highlight how the analytic framework for providing retirement income planning advice can be improved compared to what is used by industry experts and in the curriculums of leading credential programs.
Here are three decisions that investors sometimes need to make: (1) whether to convert funds this year from a tax-deferred account (TDA), like a 401(k), to a Roth account; (2) whether to contribute this year to a TDA or a Roth account; and (3) how to tax-efficiently withdraw funds in retirement, where withdraw is interpreted broadly to include Roth conversions.
In this article, I present examples that clearly show the proper analytic framework for making these decisions should be based on comparisons of marginal tax rates (MTRs) across years, where the MTR is the tax rate paid on the next dollar of ordinary income. Unfortunately, many financial professionals think these decisions should be made based on comparisons of tax brackets across years. To illustrate the wide use of advice based on tax brackets instead of MTRs, I use recent publications by Ed Slott (2021) and Michael Kitces (2021). Separately, I then discuss a detailed case that Pfau (2021b) uses to illustrate a tax-efficient withdrawal strategy in retirement that is based on efficient MTR management. However, he mislabels this strategy as an example of “tax-bracket management.” Finally, I note that the top two retirement income credentials – American College – the Retirement Income Certified Professional (RICP) and Investment and Wealth Institute – Retirement Management Analyst (RMA) – emphasize the use of “tax bracket management” and “tax bracket planning” when selecting a withdrawal strategy in retirement.
I chose to discuss these works by Slott, Kitces, and Pfau, when I could have discussed works of others, because they are recognized leaders in the investment profession. Since these recognized leaders and the top retirement credential programs in our industry are making this mistake , I am confident that many other investment professionals are also doing so.
In preretirement years, a household’s MTR is generally the same as its tax bracket. However, as I show in the next section, once a household begins receiving Social Security (SS) benefits, there is a wide range of income where its MTR is either 150% or 185% of their tax bracket. Furthermore, if this retired household will be on Medicare two years hence, then as its income this year continues to rise beyond the point where 85% of SS benefits is taxed, which is the maximum, there are up to five huge spikes in their MTR that occur due to income-based Medicare premiums. In short, for pre-retirement households, their MTR is generally the same as their tax bracket. However, for retired households with more than a subsistence level of savings, their MTR is often much higher than their tax bracket. Thus, Slott (2021) and Kitces’ (2021) analytic framework, which is based on comparing tax brackets across years instead of comparing MTRs across years , is inappropriate for helping most investors make the important decisions mentioned above.
The next section explains how the taxation of SS benefits and income-based increases in Medicare premiums – Income Related Monthly Adjustment Amounts (IRMAAs) – can cause retirees’ MTRs to substantially exceed their tax brackets. The following section then presents material from Slott (2021) and Kitces (2021) that confirms that their analytic frameworks are based on tax brackets instead of MTRs . In addition, it examines a case study by Pfau (2021) where he recommends a highly tax-efficient withdrawal strategy that is based on MTR management. However, he inappropriately labels his work as based on tax-bracket management.
In a final section, I list factors that should be included in the analytic framework for considering whether a household should make a Roth conversion in 2021. The Income Solver software (www.incomesolver.com) provides the only analytic framework that considers all factors that need to be considered. It provides the proper framework that financial advisors can use to help their clients make all three of these important financial decisions.
Marginal tax rates versus tax brackets in retirement
In Chapter 5 of Reichenstein (2019), I list and discusses five factors that can cause MTRs to exceed tax brackets. One of these factors is the taxation of long-term capital gains and qualified dividends. In 2021, the tax rate on these sources of income is 0% for single individuals with taxable income below $40,400, 15% for singles with taxable income between $40,400 and $445,850, and then 20% for singles with higher levels of taxable income. For married couples filing jointly (henceforth, married couples), the tax rate is 0% for taxable income below $80,800, 15% for those with taxable income between $80,800 and $501,600, and then 20% for those with higher levels of taxable income. Two of the other four factors are the net investment income tax (NIIT) and the Medicare surtax. The NIIT causes a 3.8% increase in MTRs for singles with modified adjusted gross income (MAGI) above $200,000 and married couples with MAGI above $250,000, where MAGI consists of adjusted gross income (AGI) with some adjustments.1 The Medicare surtax causes a 0.9% increase in MTRs at MAGI levels above $200,000 for singles and $250,000 for couples. Therefore, most clients of financial advisors pay 15% tax rate on long-term capital gains and qualified dividends; they have incomes that are below the threshold levels for the NIIT and Medicare surtax. Even if their income exceeded the threshold level for the NIIT and Medicare surtax, the increase in MTRs would be relatively small. Thus, these three factors usually have little, if any, impact on the MTRs of most clients of financial advisors.
However, the other two factors – the taxation of SS benefits and income-based increases in Medicare premiums – frequently cause large increases in MTRs for retirement-age households. Therefore, in this section, I explain how these two factors affect MTRs for retirement-age households.
Taxation of Social Security benefits
The amount of a household’s SS benefits that is included in AGI depends upon the household’s level of provisional income (PI). By definition, PI = MAGI + one half of SS benefits + tax-exempt interest. MAGI appears in various places in the tax code, but its definition changes with each use. Thus, I use “MAGIpi” to denote this definition. For most retirees, MAGIpi consists of everything in AGI after deducting the taxable amount of SS benefits.
There are two PI income threshold levels for singles, heads of households, qualifying widow(er)s with a dependent child (henceforth, singles) of $25,000 and $34,000 and two for married couples of $32,000 and $44,000. These income threshold levels have remained constant through the years. For a single household, the amount of SS benefits included in AGI is the lowest of three amounts: (1) 85% of SS benefits; (2) $0.50 for each dollar of PI between $25,000 and $34,000 plus $0.85 for each dollar of PI above $34,000; or (3) half of SS benefits plus $0.85 for each dollar of PI above $34,000. Unless annual SS benefits are below $9,000 for a single taxpayer, the amount of SS benefits included in AGI is the lower of (1) $4,500 + $0.85(PI - $34,000) or (2) 85% of SS benefits.
The amount of SS benefits included in AGI for a married couple follows the same format, except the higher PI income threshold levels of $32,000 and $44,000 apply. Unless annual SS benefits are below $12,000 for a married couple, the amount of SS benefits included in AGI is the lower of (1) $6,000 + $0.85(PI - $44,000) or (2) 85% of SS benefits.
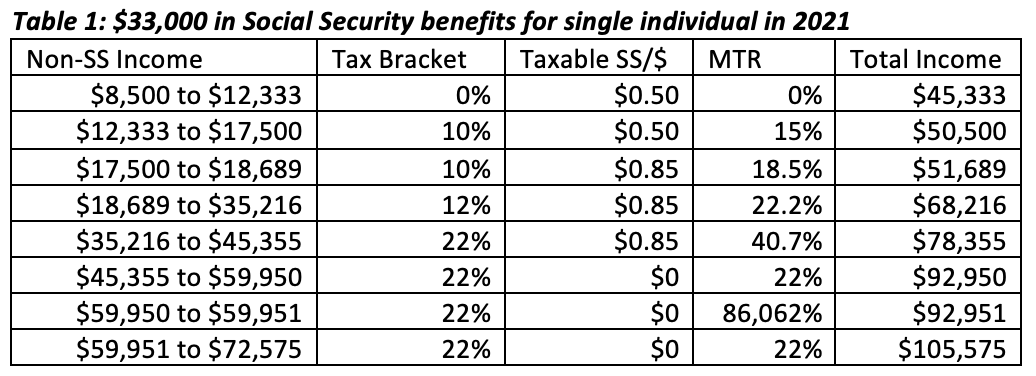
The goal of table 1 is to show the difference between tax brackets and marginal tax rates for a typical retired single individual. Although table 1 is for a single individual, the same lessons apply to married couples. For simplicity, I assumed that this individual lives in a tax-free state. Table 1 shows the range of MAGIpi + tax-exempt interest (henceforth, non-SS income) that, due to the taxation of SS benefits, is subject to MTRs of 150% or 185% of the tax bracket. To calculate the tops of tax brackets, I had to make some assumption about the composition of non-SS income. I assumed these households have no long-term capital gains, qualified dividends, or tax-exempt interest. Therefore, the calculations in table 1 of the levels of non-SS income that places a household at the tops of tax brackets may be somewhat off for some households. However, this assumption does not affect the major lessons in this article.
Table 1 illustrates the difference between single Sally’s tax bracket and her MTR at various levels of non-SS income, where all amounts are rounded to the nearest dollar. Her 2021 annual SS benefits will be $33,000. This would be her annual benefit level if she has a primary insurance amount (PIA) of $2,750 and begins her benefits at her full retirement age (FRA). It would also be her annual benefit level if she has a PIA of $2,083.40, FRA of 66, and began her benefits at age 70.
At non-SS income of $8,500, PI reaches $25,000, the first income threshold level. Each dollar of non-SS income between $8,500 and $12,333 causes an extra $0.50 of SS benefits to be included in AGI. At non-SS income of $12,333, Sally’s PI is $28,833, [$12,333 + 0.5($33,000)]. So, $1,917 of her SS benefits are included in AGI. Thus, her AGI is $14,250, [12,333 + $1,917]. Assuming she is at least 65 at the end of 2021, her standard deduction of $14,250 offsets this AGI. Thus, her tax bracket and MTR are 0% at non-SS income of $12,333 or below.
For each dollar of non-SS income between $12,333 and $17,500, an extra $0.50 of SS benefits is included in AGI. Thus, her taxable income rises by $1.50. Since she is in the 10% tax bracket, her taxes go up by $0.15. Thus, her MTR is 15%, [10% x 1.50].
At non-SS income of $17,500, her PI is $34,000, the second PI income threshold level. Thus, each dollar of non-SS income between $17,500 and $18,689 causes another $0.85 of SS benefits to be taxed. Thus, her taxable income rises by $1.85. Since she is in the 10% tax bracket, her taxes go up by $0.185. Thus, her MTR is 18.5%, [10% x 1.85].
At non-SS income of $18,689, her taxable income reaches the top of the 10% tax bracket. Thus, each dollar of non-SS income between $18,689 and $35,216 causes another $0.85 of SS benefits to be included in AGI. Since she is in the 12% tax bracket, her MTR is 22.2%, [12% x 1.85].
At non-SS income of $35,216, her taxable income reaches the top of the 12% tax bracket. Thus, each dollar of non-SS income between $35,216 and $45,355 causes another $0.85 of SS benefits to be taxed. Since she is in the 22% tax bracket, her MTR is 40.7%, [22% x 1.85].
At non-SS income of $45,355, 85% of her SS benefits is included in AGI, which is the maximum.
In short, due to the taxation of SS benefits, Sally’s MTR is 150% or 185% of her tax bracket for non-SS income between $12,333 and $45,355. This income range is referred to as the “tax torpedo.” At the end of the tax torpedo, Sally’s MTR falls sharply from 185% of her tax bracket to her tax bracket. Sally’s MTR is 185% of her tax bracket for non-SS income between $17,500 and $45,355, which is an income range of $27,855. From table 1, Sally’s total income – that is, non-SS income + annual SS benefits – at the end of the tax torpedo is $78,355. Thus, many single clients of financial advisors have non-SS income that place them within this tax torpedo, where their MTRs are much higher than their tax brackets.
 Income-based increases in Medicare part B and D premiums
Based on 2021 tax brackets, the taxation of SS benefits causes Sally’s MTR at the end of the tax torpedo to be 18.7%, [40.7% - 22%], higher than her tax bracket. However, based on the Tax Cuts and Jobs (TCJA), the federal-alone MTR at the end of the tax torpedo is scheduled to be 21.25% higher than her tax bracket beginning in 2026, [46.25% - 25%, where 46.25% = 25% tax bracket x 1.85]. Moreover, the currently scheduled higher tax rates (i.e., 10%, 15%, 25%, etc.) may return sooner than 2026 and they may rise farther than they are currently scheduled to rise. In short, beginning in 2026 (if not sooner) and continuing for the rest of Sally’s life, the difference between her federal-alone MTR and tax bracket near the end of the tax torpedo due to the taxation of SS benefits will likely be at least 21.25%, and it may be larger. Since most states impose income taxes, even if federal tax rates do not increase beyond the scheduled increases in the TCJA, many retirees will have federal-plus-state MTRs of 50% or higher on a wide range of their non-SS income for most of their retirement years. I will explain the other lines in table 1 after discussing the income-based increases in Medicare premiums.
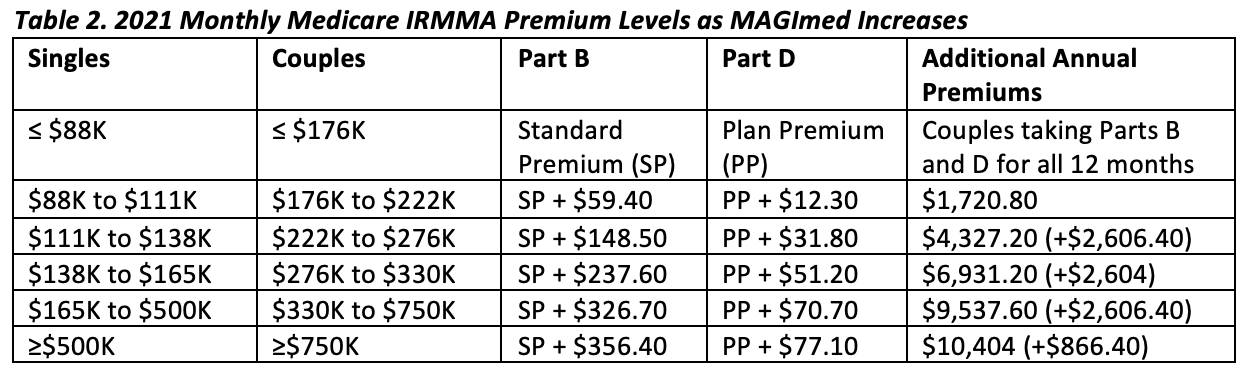
The Affordable Care Act instituted higher Medicare premiums for retirees as their income level increases. Since the level of Medicare premiums increases as a household’s income increases, these increases are effectively tax increases. The term denoting the portion of premiums that increases with income is called the income-related monthly adjustment amount (IRMAA). In general, Medicare premiums for one year are based on MAGI levels from two years earlier.2 As noted earlier, the term “modified adjusted gross income” is used in various places in the tax code, but its definition varies with each use. Consequently, in this paper, I use “MAGImed” to denote the definition of MAGI as used to determine the level of Medicare premiums. MAGImed is defined as AGI plus tax-exempt interest.
Table 2 shows how monthly 2021 Medicare premium levels increase when MAGImed levels in 2019 breach income threshold levels. The 2021 income threshold levels for MAGImed are $88,000, $111,000, $138,000, $165,000, and $500,000 for single taxpayers. Except for the last income threshold level, these threshold levels are twice as high at $176,000, $222,000, $276,0000, $330,000, and $750,000 for married couples.
I explain how the 2019 MAGImed level affects monthly Medicare premiums in 2021 for a single taxpayer, but the same logic applies to married couples. For MAGImed of $88,000 or lower, the standard premium for Part B applies, which in 2021 is $148.50 per month and, when applicable, the plan premium for Part D (drugs) applies. The monthly Part D plan premium varies with each insurance plan. Part D coverage is optional. However, if the last dollar of income in 2019 causes MAGImed to exceed $88,000 by a single cent, then the monthly Part B premium in 2021 increases by $59.40 per month, while the Part D monthly premium, if applicable, increases by $12.30 per month. If a single taxpayer is covered by Parts B and D for all 12 months of 2021 then her annual premium rises by $860.40, [{$59.40 + $12.30} x 12 months] plus she owes an additional $0.22 of income taxes in 2019 on this last dollar of income. Thus, this dollar of 2019 income causes her to pay $860.62 more to the federal government. This represents an MTR of 86,062%. Similarly, if her last dollar of 2019 income causes her MAGImed to exceed $111,000, $138,000, or $165,000, then her 2021 annual Part B and D premiums will increase by more than $1,300, which represent MTRs exceed 130,000%. Finally, for a married couple that is on Medicare Parts B and D for all 12 months of 2021, if their last dollar of 2019 income causes their MAGImed to exceed $222,000, $276,000, or $330,000, then their 2021 annual Part B and D premiums will increase by more than $2,600, which represent MTRs exceeding 260,000%.
Returning to table 1, the top of the 22% tax bracket is reached when non-SS income is $72,575. The huge spike in the marginal tax rate to 86,062% at non-SS income of approximately $59,950 represents the first spike in Medicare premiums (i.e., IRMAA).3 For simplicity, I did not include the other four IRMAA-induced spikes in MTRs. However, these other spikes in MTRs also need to be considered when making any of the three decisions discussed earlier.
A similar table for a married couple filing jointly would tell much of the same story. In particular, the MTR for a typical married couple is 185% of the tax bracket for a wide range of income, before it falls back to the tax bracket at the end of the tax torpedo.4 Furthermore, due to IRMAAs, there could be five huge spikes in their MTR, three of which would exceed 260,000%, at higher levels of income.5 As with single retirees, there are substantial differences between tax brackets and MTRs for a typical married couple who has begun SS benefits and will be on Medicare two-years hence.Return to table 1 and note the substantial difference between tax brackets and MTRs for this retired single taxpayer who has begun SS benefits and will be on Medicare two-years hence. As shown in Table 1, the 2021 tax brackets rise smoothly for a typical retired single individual. However, for this typical retired single individual, her MTR rises from her tax bracket, to 150% of her tax bracket, to 185% of her tax bracket before falling sharply back to her tax bracket at the end of the tax torpedo. Furthermore, due to IRMAAs, as her income continues to rise, there can be up to five huge spikes in her MTR, three of which would exceed 130,000%.
In summary, single and married clients of financial advisors generally have MTRs that are the same as their tax bracket in years before they begin receiving SS benefits and at least two years before they begin Medicare. In contrast, households that have begun SS benefits typically have a wide range of income, where their MTR will be 185% of their tax bracket. When their income reaches the end of the tax torpedo, then their MTR drops sharply from 185% of their tax bracket back to their tax bracket. These households also need to consider the huge spikes in their MTRs associated with IRMAA-induced spikes in Medicare premiums. A key lesson is that a typical retired household’s MTRs are substantially different than their tax brackets. And for each of the three investment decisions discussed earlier, the proper analytic framework depends in part upon the household’s MTRs in their retirement years; that is, these decisions should not be based on their tax brackets in their retirement years.
Emphasis on tax brackets in Slott (2021) and Kitces (2021) and Pfau’s (2021) misnamed “tax-bracket management”
Slott
I highly recommend Ed Slott’s (2021) new book, The New Retirement Savings Time Bomb. As with his other works, Slott once again demonstrates why he is considered the top IRA advisor. However, in this book, Slott inappropriately concludes that investors should compare their current tax bracket to their expected tax bracket in retirement when considering whether to convert funds this year from a TDA to a Roth account.
On page 228, Slott writes, “The core issue for planning a Roth conversion is whether retirement will put you in a lower or higher tax bracket.” Similarly, on page 226, he writes “The number one factor [when considering a Roth conversion] is taxes, meaning the difference between the tax rates paid up front (now, at conversion) vs. the projected tax rates later, either during your retirement or when your beneficiaries withdraw the funds” (parentheses in the original).
Suppose a household is considering making a Roth conversion this year when they will be in the 22% tax bracket and withdrawing the funds in retirement in 2026 or later when they expect to be in the 15% tax bracket. Slott would conclude that they should not make the Roth conversion this year, because the 22% tax bracket is higher than 15% tax bracket. However, suppose that this couple will begin SS benefits in 2026. If the TDA funds in question are converted to a Roth account this year, they will be taxed at an MTR of 22%. If these funds are retained in the TDA and withdrawn in 2026, then they will be taxed at an MTR of 27.75%, [tax bracket x 1.85], due to the taxation of SS benefits. In this case, this household should make the Roth conversion this year, because the 22% MTR is lower than the 27.75% MTR.
Slott’s analytic framework, which is based on tax brackets, is wrong!
Let’s change this example slightly. Suppose this married couple could convert $10,000 of pretax funds from a TDA to $7,800 of after-tax funds in a Roth account in 2025, since they will have an MTR of 22% that year, which will also be their tax bracket (i.e., they will not receive SS benefits in 2025 and they will not be on Medicare in 2027). They will begin SS benefits in 2026, and they will be in the 25% tax bracket that year. For simplicity, assume the funds in the TDA if not converted in 2025 or the funds in the Roth if converted in 2025 will earn a 0% return before being withdrawn in 2026. This $7,800 tax-free withdrawal from their Roth account in 2026 could reduce their TDA withdrawal that year to meet their spending needs by $14,512, [$7,800/(1 – 0.4625), where their MTR will be 46.25% = 25% tax bracket x 1.85]. Thus, making the Roth conversion in 2025 would allow their remaining TDA balance at the end of 2026 to be $4,512 higher.
On page 226, Slott compares the after-tax values n-years hence of $100,000 in a TDA if converted to a Roth account this year or retained in the TDA. To hold everything else constant, the underlying investment is assumed to be the same in the TDA or the Roth account and the funds will be withdrawn and consumed n-years hence. He assumes the cumulative return will be 200%. Thus, (1+r)n = 3, where r is the geometric average annual pretax return and n is the length of the investment horizon before the funds are withdrawn and spent. In either case, he assumes a 30% tax rate with taxes paid from TDA withdrawals. If converted this year, the after-tax value of the Roth account after conversion this year will be $70,000, and its after-tax value n-years hence will be $210,000. If retained in the TDA until retirement, its pretax value n-years hence will be $300,000, but its after-tax value will be $210,000. As he writes, “the net result is exactly the same” (italics in the original).
Consistent with this example, on page 228, Slott writes, “It’s all about the tax rates, not inflation, not earnings, and certainly not ‘opportunity cost.’” As his own example proves, the decision to make a Roth conversion this year is not dependent on the assumed return (r%), the length of the investment horizon (n), nor the fact that the taxes on the conversion amount must be paid this year instead of n-years hence, (i.e., the opportunity cost of paying taxes this year).
Ironically, a few pages later on page 231, Slott states, “The tax cost may not be worth the benefits if the funds won’t have time to grow. … Roth conversions are not for the short term.” This conclusion is rejected by his own example from five pages earlier, which shows that the length of the investment horizon is irrelevant!
Or consider the following example. George is single and, to meet his spending needs in 2021, he must withdraw $10,000 from his TDA. This $10,000 plus taxable interest and pension income makes his total non-SS income in Table 1 $45,400, which is slightly beyond the end of the tax torpedo. From table 1, he could convert $14,000 to a Roth IRA and these funds would be taxed at an MTR, which would also be his tax bracket, of 22%. Assume in 2022 and 2023, he will be in a similar financial situation. That is, to order to meet his spending needs (and assuming he does not make a Roth conversion in 2021), then he will have to withdraw about $10,000 from his TDA in 2022 and 2023, where these withdrawals would be taxed at an MTR of 40.7%, [22% tax bracket x 1.85]. Instead, assume George made the $14,000 Roth conversion in 2021. In 2022, he could make a tax-free withdrawal of half of these Roth IRA balances and withdraw the other half in 2023. These tax-free Roth withdrawals would allow him to avoid most of his TDA withdrawals in these years that would have been taxed at an MTR of 40.7%. In short, it would be better for him to convert TDA funds to a Roth account in 2021 that would be taxed at an MTR of 22% than to miss this opportunity and have to withdraw additional TDA funds in 2022 and 2023 that would be taxed at an MTR of 40.7%. As Slott’s own example on page 226 shows, the length of the investment horizon is irrelevant!
Later, also on page 231, Slott concludes “If the only funds you’ll have available to cover the taxes come from the IRA itself, then don’t do the conversion.” Again, his own example refutes this conclusion. Suppose a 60-year-old retired married couple has an MTR, which is also their tax bracket, of 22% this year. If not converted this year, then the withdrawal of these TDA funds in retirement will be taxed at an MTR of 46.25%, [25% tax bracket x 1.85]. If the only funds to pay the taxes on the Roth conversion are remaining funds in the TDA then they should make the Roth conversion this year. The after-tax value of each dollar of TDA funds converted this year would be worth 45% more than if these funds remained in the TDA, [(1 – 0.22)/(1 – 0.4625) = 1.45]. Both Reichenstein (2019) and Slott make the point that, when possible, taxes on Roth conversions should be paid from non-retirement funds held in a taxable account instead of from TDA funds. Nevertheless, as shown in Slott’s own example, his statement in the first sentence of this paragraph is wrong!
On page 231, Slott (2021) recommends that, in general, folks who are over 72 and subject to RMDs “should avoid a Roth conversion.” Again, his analytic framework considers tax brackets, instead of MTRs. As he notes, funds eligible for a Roth conversion would only be funds available after satisfying their RMDs. Since the tax bracket on additional IRA withdrawals after satisfying RMDs would not fall, his analytic framework fails to recognize the opportunity that these older retirees have to exploit the sharp drop in their MTR from 185% of their tax bracket to their tax bracket that exists beyond the end of the tax torpedo, but before the first MAGImed income threshold level.
Slott makes the important point that if the investor is younger than 59.5, then the withdrawal of funds from the TDA to pay taxes this year on the Roth conversion would be subject to that year’s tax bracket plus a 10% penalty tax for withdrawing funds from the TDA before age 59.5. Thus, it seldom makes sense to make a Roth conversion before age 59.5 if the taxes must be paid from funds withdrawn from the TDA. Again, there is so much that is right and valuable in his new book. But it is important to note his errors, which are based on his inappropriate analytic framework that is based on comparisons of tax brackets.
Kitces
Kitces (2021) considers whether someone should contribute this year to a TDA or a Roth account. He inappropriately concludes that they should compare their current tax bracket to their expected tax bracket in retirement when making this decision.
On page 3, he writes, “Imagine for a moment that you are going to receive a $5,000 bonus from your employer … and are suddenly faced with the decision of where to save this additional income.” If you decide to save in a TDA, you will have an additional $5,000 of pretax funds in this TDA this year, due to the associated upfront tax deduction. In contrast, if you decide to save in a Roth account, and “your federal-plus-state marginal tax rate is 25%, only $3,750 will actually end out in the Roth account (with the other $1,250 going to taxes).” He then assumes that, whether the funds are saved in a TDA or Roth account, the funds are eventually withdrawn and spent after the funds double in value, (i.e., (1+r)n = 2). The Roth account funds will be worth $7,500 after taxes at withdrawal and can be withdrawn and used to finance $7,500 of spending, which requires after-tax funds. The TDA funds will be worth $10,000 before taxes. On page 3, he writes, if “tax rates haven’t changed, [the tax liability] will reduce its value by 25%, to a net value of $10,000 – (25% x $10,000) = $7,500 of after-tax value. … As a result, regardless of the time horizon [i.e., n] or the growth rate [i.e., r], the after-tax value of a traditional retirement account is always exactly the same as the value of the Roth account (as long as the tax rates remain the same)” (italics and parentheses in the original).6
However, suppose the federal-plus-state tax bracket remains the same at 25%, but the $10,000 TDA withdrawal in retirement will cause an extra $8,500 of SS benefits to be taxed (and this extra $8,500 of taxable income would still be subject to the 25% tax bracket). The MTR on this TDA withdrawal would be 46.25%, [25% tax bracket x 1.85]. In this case, if the funds are contributed to a Roth account this year, then they would buy 62% more goods and services than if they are contributed to a TDA this year, despite the fact that the tax brackets in the contribution and withdrawal years remained the same, [$7,500 for Roth/($10,000 x (1 – 0.4625)) for TDA = 1.62].
In many prior writings, Kitces noted the importance of using marginal tax rates and the impact of the taxation of SS benefits and IRMAAs on marginal tax rates. I do not recall any other error in his prior works, which beats my record! However, in the paper in question, he wrote, “… regardless of the time horizon or the growth rate, the after-tax value of a traditional retirement account is always exactly the same as the value of the Roth account (as long as the tax rates remain the same)” (italics and parentheses in the original). This statement, which is based on the comparison of tax brackets across years, is wrong.
As usual, Kitces provides many valuable comments. For example, he emphasizes that many households will experience a wide range of incomes through their lifetimes. In general, saving for retirement in Roth accounts should be utilized in low tax-rate years, while saving in TDAs should be saved for high tax-rate years. However, what his analytic framework in this paper, which is based on a comparison of tax brackets in the contribution and withdrawal years, fails to recognize is that the MRT of TDA withdrawals in retirement will often be much higher than the tax bracket in the withdrawal year.
Pfau
Pfau (2021a) is an excellent book. I will focus on part of chapter 10 that was published separately as Pfau (2021b), “Enhancing Retirement with Tax-Bracket Management.” As a preview, the best of the withdrawal strategies he presented is highly tax efficient. However, as I explain, this tax efficiency is due to MTR management. It has nothing to do with tax-bracket management. Thus, I applaud his recommended strategy, but he mislabels this strategy as tax-bracket management. Furthermore, he uses the term tax-bracket management to discuss tax-efficient withdrawal strategies throughout Chapter 10.
In this article, he compares five combinations of SS-claiming strategies and withdrawal strategies for a 60-year-old single female. She has $400,000 in a taxable account (with cost basis of $400,000), $1,300,000 in a TDA, and $300,000 in a Roth account. She will spend $95,000 per year. Her primary insurance amount is $2,500. Pfau makes simplifying assumptions such as 0% inflation and asset returns of 2% nominal interest, which avoids a lot of complexities caused by the favorable rules governing the taxation of long-term capital gains and qualified dividends.
In the worst of the five strategies presented, she files for SS benefits at 62 and withdraws funds from her financial portfolio following the conventional wisdom. That is, she withdraws all funds from her taxable account until exhausted, then withdraws funds from her TDA until exhausted, and then withdraws funds from her Roth account until exhausted. With this “CW SS at 62” strategy, her portfolio lasts 28.99 years.
He calls the best strategy, “Outcome for Claiming Social Security at 70, Managing $111,000 Adjusted Gross Income for the First Ten Years, and then $25,000 of AGI for the Rest (Using Roth Conversions).” In this strategy, she delays SS benefits until 70. In the first 10 years (i.e., from age 60 through 69), she sets her AGI, which is also her MAGImed, at $111,000 to avoid the second IRMAA. As explained earlier, the MTR on the next dollar of income would exceed 130,000%. So, this strategy for the first 10 years is based on effective MTR management. In the first four years, she withdraws funds from her taxable account to meet her spending needs and then makes Roth conversions until AGI and MAGImed are $111,000. Although she has to pay the first IRMAA, which has a large MTR, these Roth conversions are generally made at MTRs that are also her tax brackets of 0% to 24%. Her taxable account is exhausted after her fourth year. In the fifth through tenth years, she withdraws $111,000 from her TDA and then makes a small withdrawal from her Roth account to pay the taxes.
Pfau writes, “At 70, [i.e., beginning in Year 11], Social Security begins and a new AGI target of $25,000 is used for the remainder of retirement.” She withdraws $18,157 from her TDA and then makes tax-free withdrawals from her Roth account to meet the rest of her spending needs and to pay her tax bill, where her tax bills in years 11 and 12 include one IRMAA that Pfau properly considers taxes. This produces a taxable income each year beginning in year 11 that puts her within the 15% tax bracket, which is scheduled to return in 2026. The Roth withdrawals in the first four retirement years that are generally taxed at MTRs of 0%, 10%, 12%, or 24% provide the ammunition that allows her to avoid additional TDA withdrawals in year 11 and later years that would have been taxed at MTRs of 27.75%, [15% tax bracket x 1.85], due to the taxation of SS benefits.
This is effective MTR management. As Pfau writes, “The reason this strategy is so effective is because it worked to further reduce the Social Security tax torpedo.” However, since her taxable income is well within the 15% tax bracket beginning in year 11, this withdrawal strategy has nothing to do with tax-bracket management. The tax bracket on the last TDA withdrawals in each of the first 10 years exceeds the 15% tax bracket that applies to the last TDA withdrawals in each year beginning with year 11. In this strategy, her portfolio lasted 34.62 years, which is 5.63 years longer than in the “CW SS at 62” strategy.
I applaud Pfau for finding this tax-efficient withdrawal strategy. However, as I explained, it has nothing to do with tax-bracket management. His recommended withdrawal strategy is tax efficient because it effectively uses MTR management.
I thank Pfau for recommending Reichenstein (2019) in his list of further reading. It is his only recommended reading related to tax-efficient withdrawal strategies in retirement. However, there is one aspect of our analytic framework in the www.ssanalyzer.com software that his analysis missed or chose to ignore. When he discussed the remaining financial balances that are available to heirs if the retiree should die at various ages, he considered each dollar of pretax balance in a TDA to be equivalent to each dollar of after-tax balance in a Roth account. Heirs spend after-tax dollars. Thus, $100,000 of balances remaining in a Roth account is more valuable than $100,000 of balances remaining in a TDA. In the ssanalyzer software, the user can insert a beneficiary tax rate that converts pretax balances in a TDA to after-tax balances that are available to heirs. By converting pretax balances to after-tax balances, this software allows users to find a withdrawal strategy that maximizes the after-tax value of projected inheritances.
Finally, Pfau is extremely well versed in issues related to the tax-efficiency of withdrawal strategies in retirement. Yet, I question how long it took him to come up with this strategy despite making the numerous simplifying assumptions mentioned earlier. I strongly suspect that few financial advisors would have come up with this strategy. In contrast, the www.ssanalyzer.com software is programmed to run numerous combinations of SS claiming strategies and withdrawal strategies and returns a list of the top strategies. This is an important advantage of this software.
Size of MTR in retirement varies with size of TDA balances
Notice that the MTR on the next dollar of TDA withdrawals depends in part on the size of prior TDA withdrawals. Return to table 1 and assume that Sally is 72 years old. In this example, let’s initially assume that her only non-SS income in retirement will be TDA withdrawals to meet her RMD.7 She wants to withdraw funds from her TDA to the top of the 22.2% MTR, which is also the top of the 12% tax bracket. From table 1, her planned TDA withdrawals would be $35,216. In this case, her target TDA balance at the end of the year before she turns 72 might be $964,918, [$35,216 x 27.4, where her age-72 RMD would be her prior year ending TDA balance divided by 27.4]. The MTR on the next $10,139, [$45,355 - $35,216], of TDA withdrawals would be 40.7%. Then, the MTR on the next approximately $14,595, [$59,950 - $45,355], of TDA withdrawals would be 22%. At approximately that income level, her MTR on the next dollar of income will spike to more than 86,000%.
The lesson is that a retiree’s MTR in retirement years will depend in part on the size of her non-SS income, and TDA withdrawals are often the major and sometimes the only source of non-SS income. Again, the size of a retiree’s MTR on additional TDA contributions depends in part on the size of her existing TDA balances. Suppose Sally expects to have a moderate level of TDA balances in retirement. Suppose one additional year of TDA contributions will force Sally to pay an MTR of 185% of her tax bracket on the additional TDA withdrawals in retirement that are attributable to this last TDA contribution. In this case, she should consider contributing to a Roth account instead.
Next, assume Sally expects to have a relatively high level of wealth in retirement. Suppose her last yearly contribution to her TDA causes her TDA balance in the year before she turns 72 to be $27,400 higher than it would have been if she made this contribution to a Roth account. In this case, this last TDA contribution would increase her age-72 RMD by $1,000, [$27,400/27.4], which could force her to pay an additional IRMAA exceeding $1,300 (based on 2021 IRMAAs). Moreover, assuming modest returns, this last TDA contribution could force Sally to pay an additional IRMAA during several of her retirement years – and these IRMAAs are on top of the normal income taxes she would pay on these TDA withdrawals.
The analysis for a married couple is similar, except their decision to save one more year in a TDA instead of a Roth account could cause them to pay more than $2,600 (based on 2021 IRMAAs) in additional Medicare premiums during several of their retirement years – and these IRMAAs would be on top of the normal income taxes they would pay on these TDA withdrawals.
A household’s decision to save in a TDA or Roth account in preretirement years should consider the MTRs that they (or their heirs) will likely pay on the additional TDA withdrawals associated with this year’s TDA contribution.
Next, let’s provide some insight as to when the TDA balance in the year before RMDs begin may force single and married households to pay MTRs of 150% of the tax bracket, 185% of the tax bracket, and the huge MTR associated with the first IRMAA. For the single household, I return to Sally in table 1 and assume she will turn 72 in 2021. She receives $33,000 in SS benefits in 2021. In this example, I initially assume her only source of non-SS income is TDA withdrawals equal to her RMD at age 72. If her TDA balance at the end of 2020 was $346,924 then her 2021 RMD would be $12,333, [$346,924/27.4]. As explained earlier, if her non-SS income was $12,333, her AGI would equal her standard deduction. So, the MTR in 2021 associated with the first $346,924 of end-of-2020 TDA balances would be 0%. However, Sally’s MTR in 2021 on end-of-2020 TDA balances between $346,924 and $479,500, [$17,500 from table 1 x 27.4] would be 150% of her tax bracket. Similarly, her MTR in 2021 would be 185% of her tax bracket for additional end-of-2020 TDA balances between $479,500, [$17,500 x 27.4], and $1,242,727, [$45,355 x 27.4]. Sally should be concerned that additional TDA balances will force her to pay the first IRMAA spike in one or more years if her end-of-2020 TDA balances exceed $1,642,630, [$59,950 x 27.4]. In summary, this single individual who receives no interest, dividends, capital gains or pension income and only withdraws the RMD from her TDA balance will face an MTR in 2021 of (1) 150% of her tax bracket if her end-of-2020 TDA balance is between $346,924 and $479,500, (2) 185% of her tax bracket if this TDA balance is between $479,500 and $1,242,727, and (3) she may be forced to pay the first IRMAA spike in Medicare premiums in one or more years if this TDA balance exceeds $1,642,630.
Let’s assume instead that Sally will receive $18,000 of income from some combination of taxable interest, capital gains, qualified dividends, and pension income. In this case, her end-of-2020 TDA balances where these higher MTRs kick in would be $493,200 lower, [$18,000 x 27.4]. Thus, her MTR would be 185% of her tax bracket for RMDs associated with end-of-2020 TDA balances between $1 and $749,527, [$1,242,727 - $493,200]. And she may be forced to pay the first IRMAA spike in one or more years if her TDA balance exceeds $1,149,430.
Next, I present estimates of the ranges of end-of-2020 TDA balances, where a married couple would have to pay elevated MTRs due to the taxation of SS benefits or IRMAAs. Assume their joint 2021 annual SS benefits total $55,000 and initially assume that their only source of non-SS income is their RMDs. They will face an MTR of 185% of their tax bracket if their end-of-2020 TDA balance is between $530,597 and $1,765,688.8 Furthermore, they may be forced to pay the first IRMAA spike in Medicare premiums in one or more years if their end-of-2020 TDA balance exceeds $3,541,450. Instead, if we assume this married couple has income from some combination of taxable interest, capital gains, qualified dividends, and pension income then the end-of-2020 TDA balances where these higher MTRs would kick in could be much lower.
The key lesson is that many, if not most, clients of financial advisors will have substantially higher MTRs in their retirement years than their tax brackets in those years. And it is their MTRs in their retirement years – and not their tax brackets these years – that should help determine (1) whether they make a Roth conversion this year; (2) whether they should contribute to a TDA or a Roth account in a preretirement year; and (3) how they should withdraw funds from their financial portfolios in their retirement years, where withdraw is interpreted broadly to include Roth conversions.
Analytic framework
This section considers the proper framework for considering whether a household should make a Roth conversion in 2021. The proper framework requires consideration of four factors: (1) how much would the 2021 Roth conversion increase income taxes in 2021?; (2) how much, if at all, would the 2021 Roth conversion increase Medicare premiums two-years hence in 2023?; (3) how much would the 2021 Roth conversion reduce taxable income and thus taxes in 2022 and later years?; and (4) how much, if at all, would the 2021 Roth conversion reduce Medicare premiums in 2024 and later years? Yes, this framework is considerably more complex than the tax-brackets-based framework recommended by Slott (2021) and Kitces (2021), but it is the right framework.
Similarly, the proper framework for comparing the merits of alternative withdrawal strategies in retirement, where withdrawal is interpreted broadly to include Roth conversions, would require consideration of all four factors. The www.incomesolver.com software provides the only analytic framework that considers all four of these factors.
Summary
After an introduction, this article explained the rules determining the taxable portion of SS benefits and income-based Medicare premiums (i.e., IRMAAs). It presented an example that showed the substantial difference between marginal tax rates (MTRs) and tax brackets for most retired single households. Furthermore, the same lessons apply to married couples filing jointly.
Using numerous examples, this study showed that it is MTRs across years, and not the tax brackets, that should be considered when deciding whether to convert funds this year from a TDA, like a 401(k), to a Roth account. Similarly, it is MTRs and not the tax brackets that should be considered when deciding (1) whether to contribute this year to a TDA or a Roth account and (2) how to tax-efficiently withdraw funds in retirement, where withdraw is interpreted broadly to include Roth conversions. I then noted that Slott (2021) inappropriately concludes that investors should compare their current tax bracket to their expected tax bracket in retirement when considering whether to convert funds this year from a TDA to a Roth account. Separately, I showed that Kitces (2021) inappropriately concludes that investors should compare their current tax bracket to their expected tax bracket in retirement when deciding whether to contribute to a TDA or a Roth account this year . Finally, Pfau (2021a and 2021b) provides a detailed case related to tax-efficient withdrawal strategies in retirement. His recommended strategy is highly efficient because it withdraws funds using efficient marginal tax rate management. However, he mislabels his work as “tax-bracket management.”
The final section presented the analytic framework that should be used to consider a Roth conversion in 2021. As noted, the proper analytic framework requires consideration of lots of moving parts. The www.incomesolver.com software provides the only analytic framework that considers all factors that need to be considered when making this decision.
I have the utmost respect for Slott, Kitces and Pfau. They are important thought leaders of our profession. But advisors must recognize the need to consider the impacts of the taxation of SS benefits and IRMAAs on marginal tax rates. Although Pfau considered these impacts, he inappropriately referred to his recommended withdrawal strategy as tax-bracket management. Since these leading scholars made these mistakes, I am confident other investment professionals are making the same mistakes. As I demonstrated here, extending the analytic framework for making the three important investment decisions from one based on a comparison of tax brackets across years to one based on a comparison of marginal tax rates across years will allow financial advisors to deliver “best-in-class” retirement advice.
Dr. William Reichenstein is principal of research for IncomeSolver.com and professor emeritus investments at Baylor University. His recent work concentrating on the interaction between investments and taxes. Bill has written more than 200 articles for professional and academic journals and several books. He is a frequent contributor to the Journal of Financial Planning, Journal of Investing, Financial Analysts Journal, Journal of Portfolio Management, and Journal of Wealth Management, and is frequently quoted in the Wall Street Journal and elsewhere. Bill earned a BA in math from St. Edward’s University and his MA and Ph.D. in economics from the University of Notre Dame. He is a Chartered Financial Analyst (CFA).
References
Kitces, Michael. 2021. “Limits of Tax Diversification and the Tax Alpha of Roth Optimization.”
Pfau, Wade D. 2021a. Retirement Planning Guidebook: Navigating the Important Decisions for Retirement Success, Retirement Researcher.
Pfau, Wade D. 2021b. “Enhancing Retirement with Tax-Bracket Management.”
Reichenstein, William. 2019. Income Strategies – How to Create a Tax-Efficient Withdrawal Strategy to Generate Retirement Income, available through Amazon.
Slott, Ed. 2021. The New Retirement Savings Time Bomb, Penguin Books.
1See https://www.irs.gov/newsroom/questions-and-answers-on-the-net-investment-income-tax
2To repeat, in general, Medicare premiums for one year are determined by the tax filing status and the MAGImed level from two years earlier. There are exceptions to this general rule. When there is a life changing event (LCE) that would lower a client’s MAGImed sufficiently to lower their IRMAA premiums for a specific year, they can file Form SSA-44 to report this LCE. LCEs include divorce/annulment, death of a spouse, work stoppage or work reduction, loss of income-producing property due to a disaster, loss of pension income, and situations where income for a year was due to a settlement with an employer for the employer’s bankruptcy or reorganization.
3This single individual’s level of MAGImed in 2021 will likely determine her 2023 level of Medicare premiums. But she will not know the precise income threshold levels (e.g., $88,000, $111,000, etc. in 2021) for 2023 until October 2022 and these income levels may be higher than the 2021 threshold levels. In Reichenstein (2019) and other publications, I encourage households to leave a comfortable margin for error when trying to manage their level of MAGImed for a year, because if this income measure exceeds a MAGImed income threshold level two years later by one cent then a single household’s Medicare premiums two years hence can rise by more than $1,300 and a married couple’s Medicare premiums can rise by more than $2,600. Thus, to leave a comfortable margin for error, in Table 1 I calculated the non-SS income level that would produce a 2021 MAGImed of $88,000, even though this MAGImed income threshold level for 2023 will likely be higher. Furthermore, since the IRMAAs in 2023 will likely be higher than their 2021 levels, this first IRMAA-induced spike in MTRs will likely exceed 86,062%, which is the estimated MTR in Table 1.
4For many married couples filing jointly, by the time their non-SS income reaches the level where their AGI reaches $27,800 – which is the standard deduction in 2021 for a MCFJ with both spouses at least 65 at the end of the year – their Provisional Income already exceeds $44,000, the second PI income threshold level. Thus, many married couples do not have an income range where their MTR once Social Security begins is 150% of their tax bracket.
5If the last $1 of income caused taxes to increase by $1 then the MTR would be 100%. Since this last $1 of income caused taxes to rise by more than $2,600, the MTR exceeds 260,000%.
6Although this quotation uses the term “tax rates,” he means tax brackets. To clearly show that Kitces’ analytic framework is built on tax brackets, consider the following quotes. From page 10, “…the truth is that for a household whose tax bracket isn’t likely to change in the future – higher or lower – it doesn’t actually matter which type of account they choose because both will have the same wealth outcome anyway!” (italics in the original). From page 13, “the Roth-versus-traditional [savings] decision matters the most when there is a significant difference between current and future tax brackets.”
7According to Kate Dore (2021), research has found that “roughly 84% of those who reached RMD age took only the minimum amounts.” See https://www.cnbc.com/2021/08/25/most-retirees-arent-tapping-nest-eggs-before-required-withdrawals.html.
8At the TDA balance of $530,597, their AGI would equal their standard deduction assuming both spouses are at least 65 at the end of 2021. Their Provisional Income would already be beyond $44,000, the second PI income threshold. So, they never face an MTR of 150% of their tax bracket.
Membership required
Membership is now required to use this feature. To learn more:
View Membership BenefitsSponsored Content
Upcoming Virtual Events View All


