How to Increase After-Tax Income for GLWB Annuities
Membership required
Membership is now required to use this feature. To learn more:
View Membership Benefits Advisor Perspectives welcomes guest contributions. The views presented here do not necessarily represent those of Advisor Perspectives.
Annuities confer a variety of tax benefits on their owners in non-qualified accounts. For example, gains in an annuity are not taxed until monies are distributed from the account.
There are two primary tax methods for annuities that offer guaranteed lifetime income, either the “tax-exclusion ratio” approach in which gains at annuitization are spread across the lifetime of the annuitant, or “worst in, first out” (WIFO) taxation in which all gains are taxed first. While the amount of gains that would be taxed are identical in either approach, the key difference in the structures is when gains are taxed.
While more traditional annuities, such as single premium immediate annuities (SPIAs) are taxed using the exclusion ratio, a growing number of annuities that offer guaranteed lifetime withdrawal benefits (GLWBs) have begun offering exclusion ratio taxation, while many still are based on WIFO taxation.
This piece explores the impact in after-tax income for GLWBs taxed using the exclusion ratio versus WIFO taxation approach. I find a significant benefit associated with exclusion-ratio taxation; the increase in the after-tax income is roughly equivalent to a 50 basis point increase in the payout rate. The potential benefit of exclusion ratio taxation is notably higher for higher tax rates and higher expected returns and is also beneficial for annuities with lower basis and investors with higher discount rates.
The benefits associated with exclusion-ratio taxation can be significant and should be considered when selecting the appropriate annuity for a non-qualified account.
Annuity taxation
Annuities provide a powerful way to grow monies in a tax deferred structure, especially for individuals who have maxed out savings in other qualified accounts (e.g., an IRA). Deferred taxation can be especially valuable for asset classes that are relatively tax inefficient, such as those with higher levels of turnover, which are taxed at marginal income tax rates.
This effect is demonstrated below, which illustrates the difference in the after-tax wealth for an account with different assumed returns (3%, 5%, or 7%) where the gains are either taxed in that year (i.e., 100% turnover) versus at the very end of the period, assuming a constant 30% tax rate.
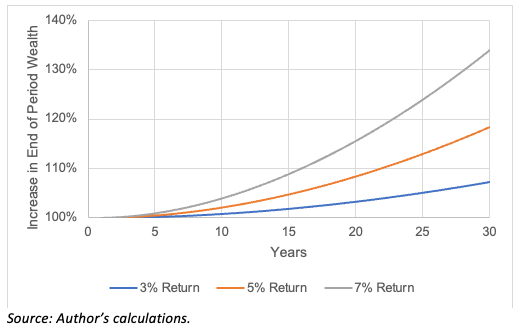
Over longer periods, the benefits of tax deferral grow, even for investments with lower returns.
The above analysis undervalues the tax benefits of annuities, though, because it assumes the annuitant liquidates the account at the end of the period (in a single year). The tax benefits of annuities will be greater if the distributions are spread out over a longer period (i.e., annuitized).
With WIFO taxation, all gains are taxed first and potentially on an on-going basis if there is any positive return. Potentially all the distributions (i.e., income) in the early years could be taxed. In contrast, with the exclusion ratio, only a portion of the income will be taxed, based on the basis and amount of income.
For either approach, once the basis has been used up, all subsequent payments are fully taxed.
Meeting the exclusion ratio test
The federal income tax treatment distributions from an annuity contract differs depending on whether the payment is treated as an “amount not received as an annuity” or as an “amount received as an annuity,” with the latter receiving more favorable tax treatment. A payment made as part of a series of periodic withdrawals will be treated as an “amount received as an annuity” only if it satisfies the following three conditions:
- The payment must be received on or after the “annuity starting date,” which is the date upon which obligations under the contract become fixed or, if later, the first day of the period in which the first annuity payment is made;
- The total amount payable must be determinable on the annuity starting date, either directly under the terms of the contract or indirectly by the use of mortality tables and/or compound interest computations; and
- The payment must be part of periodic installments made at regular intervals over a period of more than one full year from the annuity starting date.
Typical GLWB payments made under annuity contracts are not fixed. The elections under GLWBs are revocable, meaning the contract owner does not have to take any of the annual benefit in any given year and can revoke the election at any time. As a result of this critical difference, GLWB payments made pursuant to a revocable election are treated as “amounts not received as an annuity.”
In order to qualify as an election, the periodic payments cannot be stopped and the frequency of the payments cannot be changed.
Modeling the impact of the exclusion ratio
For the analysis, I determine the impact on after-tax income using WIFO and exclusion-ratio taxation. I do this based on adjusting the assumed returns, tax rates, basis (as a percentage of the initial contract value, which is assumed to be $100,000) and discount rate for net present value (NPV) calculations.
The analysis weights all cash flows by the probability of survival (longevity), based on the average survival rate for a male and female, age 65, using the Society of Actuaries 2012 immediate annuity mortality table with improvement to the year 2021. Mortality is important since, in addition to the discount rate, it assigns more weight to the earlier cash flows.
The analysis assumes an exclusion ratio of 21 years, which is consistent with the implied exclusion ratio from SPIAs obtained from CANNEX.
The income level is assumed to be constant over the period of distribution. In theory, this could increase either from a fixed cost of living adjustment (COLA) or based on market performance. The probability of an increase is important but complicates the analysis.
The exhibit below provides an example of how the after-tax cash flows differ between the two approaches assuming a 3% return and 30% tax rates, based on two different basis levels: 100% of contract value (panel A) and 60% of contract value (panel B). The latter reflects an annuity where the initial investment has grown over time, while the former reflects an annuity that is recently purchased and income begins immediately.
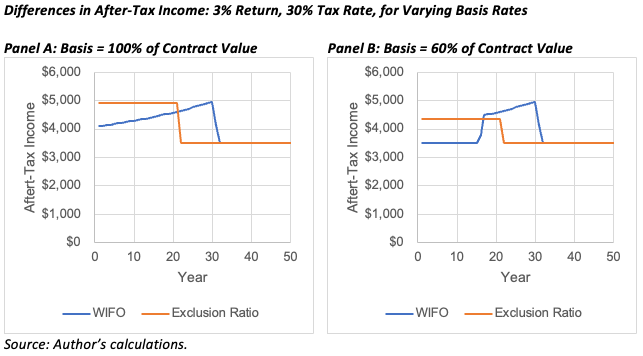
The total after-tax income generated from the two tax methods (WIFO and exclusion ratio) are identical. Over the 50 years in panel A, the total after-tax income is $205,000 and over the 50 years in panel B, the total after-tax income is $193,000. The difference between the panels reflects the difference in the basis (i.e., the basis is lower in panel B, so the after-tax income is less).
Assuming a 0% discount rate and not incorporating any mortality, an investor would be indifferent between WIFO and exclusion-ratio taxation since the sum of the cash flows is the same. However, including a discount rate (people prefer money now versus later) and mortality rates (the odds of receiving income in the first year are significantly higher than the 40th year) significantly impacts the efficacy of the two approaches.
I explore how these variables impact the results in the following sections.
Quantifying the benefit of exclusion ratio taxation
In this section, I more explicitly explore the potential increase in after-tax income that can be generated from an annuity using exclusion-ratio versus WIFO taxation. The exhibit below shows the differences in the NPV of the after-tax income from a 3% return where the basis is 100% of the purchase price for different tax rate (10% to 50% in 10% increments) and using other discount rates (0% to 8% in 1% increments).
The analysis includes results where the NPV is estimated entirely using the respective discount rate (panel A) or where the after-tax cash flows are also weighted by mortality (panel B).
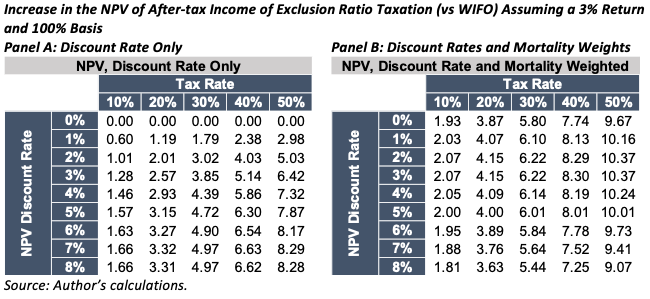
In panel A, when the discount rate is 0% there is no difference in the NPVs. This is because the cumulative after-tax income from the two taxation approaches is the same; the differences are a result of cash flow timing. Using the tax-exclusion approach, less of the income is taxed initially. When the results are weighted by mortality rates and discounted (panel B) the values are always greater than zero.
For example, in panel B, assuming a 3% discount rate and 30% tax rate, an annuity with tax exclusionary taxation would generate 6.22% more income than one that is taxed on a WIFO basis. This is a significant increase in (guaranteed) lifetime income that is unaffected by the assumed discount rates.
In the next exhibit, the analysis is extended to a situation in which the assumed basis is 100% and 60%, where the assumed return on the variable annuity is 3%.The 100% basis scenario is identical to panel B in the previous exhibit and is included primarily for reference purposes. An annuity with 60% basis would be one that has experienced growth over time (e.g., the individual purchased a variable annuity that has appreciated).
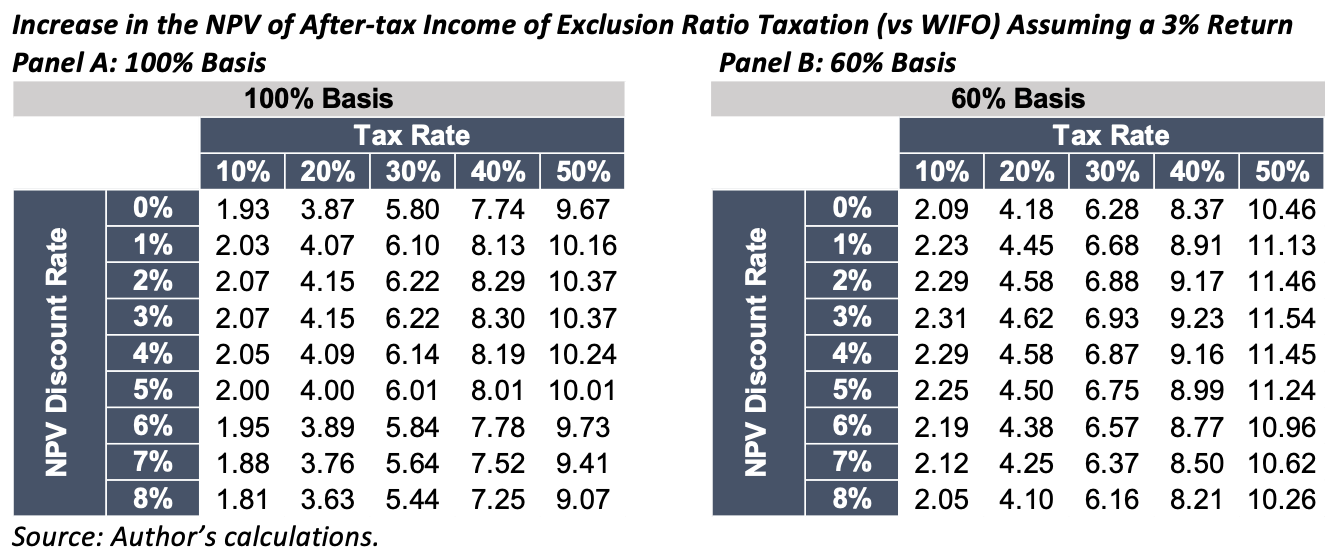
The benefits of the exclusion-ratio taxation are slightly greater when the basis is lower; however, this is partially a function of the assumed return (which is 3%). At higher returns (e.g., 6%), the exclusion-ratio taxation can be more valuable when the basis equals the purchase price, as demonstrated in the next exhibit, where the assumed discount rate is 3%.
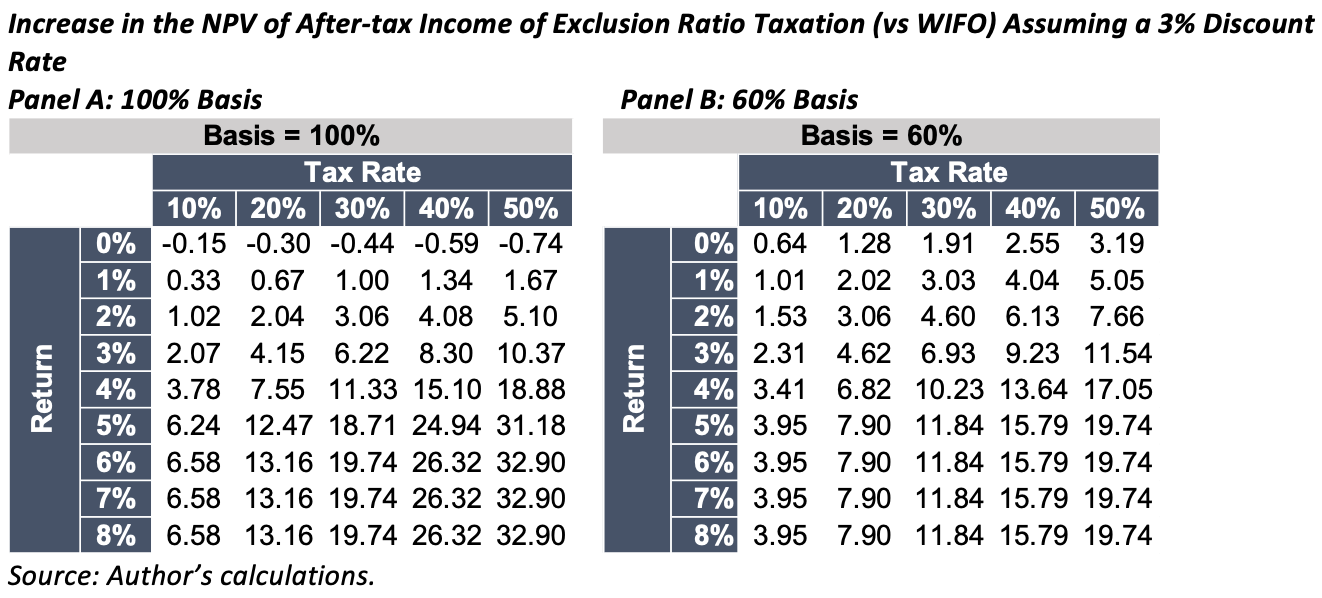 The value of the exclusion-ratio tax treatment increases with higher tax rates and higher expected returns. There is also a slight increase in the benefit for those with lower basis levels and higher discount rates, but the effect isn’t as great.
Equivalent payout rate increase
The previous analysis explored how the NPV differed by comparing the exclusion-ratio and WIFO taxation. In this section, I quantify the required increase in payout rate for the WIFO strategy to generate the equivalent level of income as the exclusion approach. I solve for this using a random sample of test cases and include the results in the exhibit below.
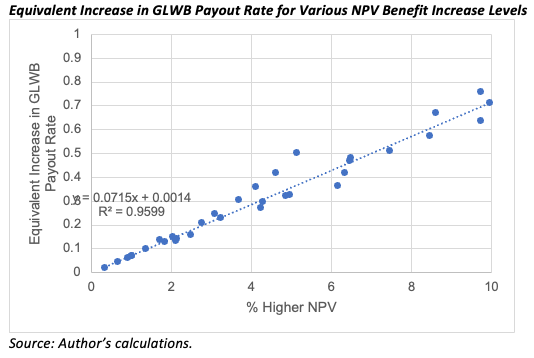
A 1% greater NPV is roughly equivalent to a .07% increase in the payout rate. Therefore, looking at the previous results, a 7% increase in the NPV would correspond to approximately a 50% basis point increase in the payout. That’s a notable increase and significant form of “tax alpha” available from using the exclusion-ratio taxation.
Quantifying the benefit of exclusion-ratio taxation using stochastic modelling
The previous analysis relied on a deterministic forecasting model, and the results could change in a stochastic setting. Therefore, I performed an additional stochastic analysis consisting of 1,000 runs for robustness purposes. The analysis considers two portfolios: a higher risk, balanced portfolio with a 4% return and 10% standard deviation and a lower risk portfolio (e.g., a FIA) with a 1% return and 3% volatility. The distribution in the NPV differences, assuming a 30% tax rate, are included below.
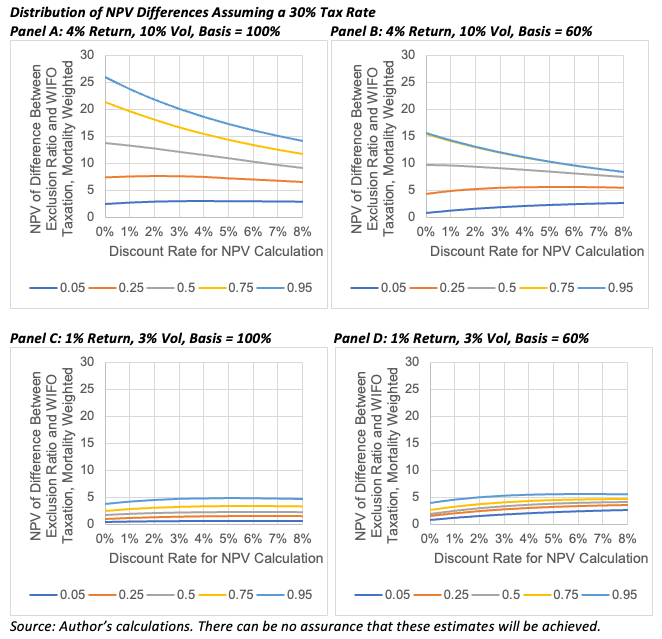
Even in the worst one-in-20 outcomes (i.e., the 95th percentile), the exclusion-ratio approach generated more after-tax income than WIFO taxation. The median benefit can be relatively significant, especially for higher-returning portfolios and for lower discount rates.
Overall, this additional analysis provides strong supporting evidence that annuities that offer the exclusion-ratio taxation provide significantly more after-tax income than those with WIFO taxation.
Conclusions
Taxes have a significant impact on the optimal retirement income strategy, yet they are often ignored in retirement modeling. This piece explored the impact of an annuity with a GLWB benefit that offers either exclusion-ratio or WIFO taxation.
I find significant evidence that annuities with exclusion-ratio taxation generate significantly more “tax alpha” that is roughly equivalent to a 50 basis point increase in the payout rate for the annuity.
These findings are important to consider when selecting annuities for non-qualified accounts.
David Blanchett, PhD, CFA, CFP®, is managing director and head of retirement research at PGIM DC Solutions. PGIM is the global investment management business of Prudential Financial, Inc. In this role he develops research and innovative solutions to help improve retirement outcomes for investors.
Membership required
Membership is now required to use this feature. To learn more:
View Membership BenefitsSponsored Content
Upcoming Virtual Events View All


