 Advisor Perspectives welcomes guest contributions. The views presented here do not necessarily represent those of Advisor Perspectives.
Expected returns are derived in two distinct ways: from Federal Reserve actions, since it is manipulating bond prices, and from momentum, which is driving stock prices. How long can both last?
There’s much discussion about the possibility of stock and bond markets being in bubbles. It boils down to return expectations. It’s a bubble if prices are expected to tumble. It’s not a bubble if prices are expected to increase.
It’s that simple.
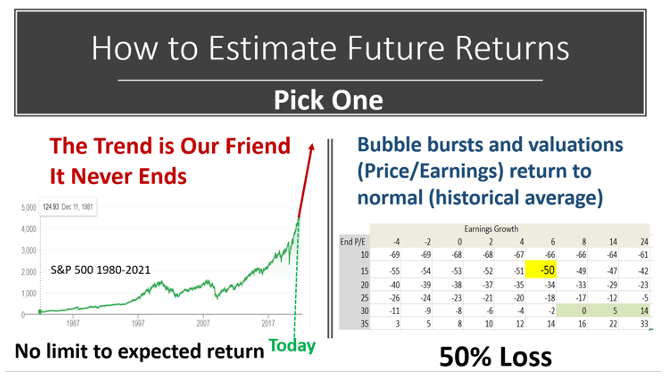
The following graph presents the choices. Pick one.
Bonds
The choice is easy for bonds. Will the Fed continue to manipulate bond yields to extraordinary lows, so interest rates are zero or even below – the zero-interest rate policy (ZIRP)? Fed Chairperson Jerome Powell has advised that “tapering” lies ahead, which translates to “less manipulation.” Bond prices will decrease, and yields will increase, unless the Fed reneges as it did in 2013 when it last tried to taper and stock prices plummeted (the “taper tantrum”).
Stocks
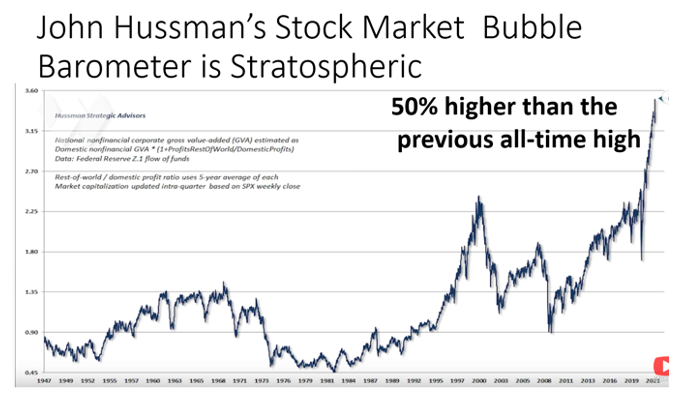
Stock prices are more complicated. Stock prices are above historical norms based on a variety pack of measures like price/earnings, the Buffett bubble barometer and the John Hussman bubble barometer shown in the next picture.
Can prices continue to go up? Of course, but what if they don’t, and prices return to more normal levels? That question is answered by the table on the right in the first exhibit above. There’s a formula that is a tautology for estimating future returns. It always works because it has to work:
Return = Dividend Yield + (1 + Earnings Growth) X (1 + P/E expansion/contraction) – 1
As you can see in the green shaded area, stocks will earn positive returns if P/E multiples remain near current levels and earnings grow by more than 6%. Momentum saves the day.
But the market will lose 50% if P/Es return to their historic mean of 15 and earnings grow at their historic average of 6%. Regression toward the mean generates large losses.
What is your outlook for earnings growth in the stock market over the next 12 months? Where do you see P/Es a year from now? You can look up your cell (forecast) in the table above.
Future P/Es are driven by investor behavior
Choosing a future P/E in the table above is the key to generating a return forecast. And therein hinges the debate about bubbles. Behavioral scientists tell us that we are not rational because we all have biases that cause us to behave irrationally. Samples of these biases and the irrational behavior they cause are as follows:
|
Bubble Inflators |
Behavioral Bias |
|
1 Vaccines will cure the pandemic quickly |
|
|
2 Earnings will soar in an economic recovery |
|
|
3 Federal Reserve will dump $trillions |
|
|
4 Interest rates will remain low |
|
|
5 Greed: FOMO is fear of missing out |
Dread aversion |
|
6 Investor euphoria: Hopium |
|
|
7 Huge foreign demand |
|
|
8 Millennials believe markets only go up |
|
|
9 FAANG Stock phenomenon |
|
|
10 Apple &Tesla are each worth a fortune |
|
|
11 The election. |
|
|
12 Belief that amateurs can beat Wall Street |
|
|
13 Stock buybacks |
|
|
14 SPACs: Special Purpose Acquisition Companies |
|
|
15 IPOs: Initial Public Offerings |
|
|
16 Inflation caused by money printing is ignored |
Conclusion
A bubble is not recognized until it bursts. In the meantime, fear of missing out (FOMO) remains today’s version of “the trend is your friend” mantra of the 1990s growth bubble.
Ron Surz is co-host of the Baby Boomer Investing Show and president of Target Date Solutions and Age Sage, and CEO of GlidePath Wealth Management.


