The Evidence Mounts Against Active Share
Membership required
Membership is now required to use this feature. To learn more:
View Membership Benefits Since the initial publication of research documenting active share, its advocates have clung to the belief that the metric could identify funds that would outperform. But the academic evidence has all but disproven that thesis.
An overwhelming body of academic research demonstrates that the past performance of actively managed mutual funds does not provide valuable information as to future performance, and (as the annual SPIVA Persistence Scorecards regularly report) there is less persistence of outperformance than randomly expected. Yet, believers in active management were offered hope with the 2009 study by Martijn Cremers and Antti Petajisto, “How Active Is Your Fund Manager: A New Measure That Predicts Performance,” published in The Review of Financial Studies. The authors concluded: “Active Share predicts fund performance: funds with the highest Active Share significantly outperform their benchmarks, both before and after expenses, and they exhibit strong performance persistence.”
Active share is a measure of how much a fund’s holdings deviate from its benchmark index, and funds with the highest active share tend to have the best performance. Thus, while there’s no doubt that, in aggregate, active management underperforms and the majority of active funds underperform every year (and the percentage that underperform increases with the time horizon studied), if an investor were able to identify the few future winners by using active share as a measure, active management could be the winning strategy.
Unfortunately, subsequent research has found problems with the conclusions drawn by Cremers and Petajisto. Using the same database they employed, Andrea Frazzini, Jacques Friedman and Lukasz Pomorski of AQR Capital Management examined the evidence and the theoretical arguments for active share as a predictor of performance and presented their findings and conclusions in the paper “Deactivating Active Share,” published in the March/April 2016 issue of the Financial Analysts Journal. The authors concluded that, controlling for benchmarks, active share has no predictive power for fund returns.
The October 2016 paper by Ananth Madhavan, Aleksander Sobczyk and Andrew Ang of BlackRock, “Estimating Time-Varying Factor Exposures,” provided an out-of-sample test (post-2009) of Cremers and Petajisto’s findings. They found that the measure of active share proposed by Cremers and Petajisto was negatively correlated (-0.75) to fund returns after controlling for factor loadings and other fund characteristics. Thus, they concluded that “it is not the case that high conviction managers outperform.”
In another out-of-sample test that used data from 2001 through 2015 on Canadian funds, Morningstar found that after adjusting for the market, size, value and momentum factors, there was no predictive value for active share. The only thing active share predicted, which should be expected, was a wider dispersion of performance outcomes – investors were taking greater risk without compensation.
Another out-of-sample test of active share was provided in the December 2017 study “Defining Activeness: Active Share, Risk Share & Factor Share.” In their study of South African funds over the period June 2003 through March 2017, authors Emlyn Flint, Anthony Seymour and Florence Chikurunhe found that once the results were adjusted for exposures to risk, “there is no discernible relationship between current active share and future active return.”
The last two papers demonstrate that active share’s failure has not been limited to the U.S. – it has been pervasive.
Another paper I reviewed was Cremers’ own October 2016 study, “Active Share and the Three Pillars of Active Management: Skill, Conviction and Opportunity.” This updated study covered the period 1990 through 2015 and is free of survivorship bias. To determine alpha, Cremers used a seven-factor model. In addition to market beta and momentum, he used two size factors and three value factors because size and book-to-market have different relationships with stock performance depending on whether one considers all stocks, only large cap, only midcap or only small-cap stocks.
While he did find that the highest active share had an abnormal (unexplained) return of 0.71% per year, it was not statistically significant (t-stat was just 1.37). He did note that the evidence that high-active-share funds outperformed low-active-share funds was stronger for funds with low expense ratios and low turnover. Given that his data indicated the outperformance had occurred prior to 2002, I contacted Cremers and asked him if he had performance data for the period 2002 through 2015. He provided me with the table below, which shows the results over that timeframe for the active share quintile portfolios (the first quintile is the lowest active share).
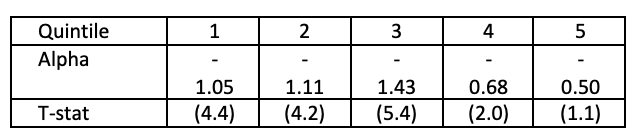
While active share may have worked prior to 2002, these results show that even the highest quintile of active share funds produced negative alphas in the post-2002 period. In other words, as markets became more efficient over time, the alpha was “gone with the wind.”
Vanguard weighs in
Vanguard’s research team also examined the evidence on active share in its July 2019 paper, “The Urban Legends of Active Share.” Its database covered actively managed U.S. open-end equity mutual funds over the 15-year period 2004-2018, including liquidated and merged funds. Following is a summary of its findings:
- On average, low-cost, low-active-share funds – part of the category of “closet index funds” – outperformed high active-share funds.
- There was a significant positive relationship between active share and expense ratios. Funds with higher active share tend to charge more: It is this relationship that led to a negative relationship between active share and net excess returns. Thus, what you pay per unit of active share was important.
- Active share was not a compensated risk premium – it led to a wider dispersion of outcomes without a corresponding increase in average returns.
Vanguard went on to note: “High-active-share funds can make it more difficult to stay the course with active strategies – they add another layer of uncertainty to active equity investing that investors should be aware of.” It added: “This larger dispersion of outcomes can be an indication of more extreme performance-chasing.” Performance-chasing leads investors (both individual and institutional) to underperform the very funds in which they invest.
Latest research findings
Morningstar provided the latest empirical evidence on active share as a predictor with its November 2021 paper, “Unattractive Share.” Following is a summary of its findings:
- Across all categories and share classes, a typical low-active-share fund (first quintile) could be had for 0.60% to 1.00%, depending on the category. High-active-share funds (fifth quintile) cost 1.10% to 1.60%.
- From 2003 through 2020, across all categories, high-active-share funds exhibited higher risk than their low-active-share peers.
- From 2011 through 2020, high-active-share funds failed to deliver superior net-of-fee results in any category.
Morningstar empirically demonstrated that since 2011 investors in high-active-share funds in all Morningstar categories have paid higher fees, incurred greater risks and earned lower returns. While it may have provided a ray of hope at one point, as Andrew Berkin and I demonstrated in our book, The Incredible Shrinking Alpha, the markets have become increasingly efficient over time, raising the hurdles for active management.
Summary
In the face of all the evidence, it is difficult to make the case that active share has any predictive value in terms of future risk-adjusted outperformance. Despite this, active share seems to be becoming an increasingly popular metric in terms of both reporting and evaluation. Given the evidence, there isn’t a logical explanation for the phenomenon other than that high active share is a necessary ingredient for outperformance. Unfortunately, it’s not a sufficient one.
There’s one more important point we need to cover.
It's not only about alpha
Investors may want to own a fund that provides exposure to factors they care about, such as market beta, size, value and momentum. They should then be happy to have minimal alpha as long as they get the beta (loading on a factor) they are seeking, which leads to higher returns. In other words, such investors should rather own a low-cost, passively managed small-value fund that provides high loadings on those factors and minimizes or even eliminates negative exposure to momentum (typical of value funds) and has no alpha, than an active fund with less exposure to those factors even if it generates positive alpha. Its positive alpha would have to be great enough to overcome the loss of returns due to the lower loading on the factors. To illustrate this point, consider the following example.
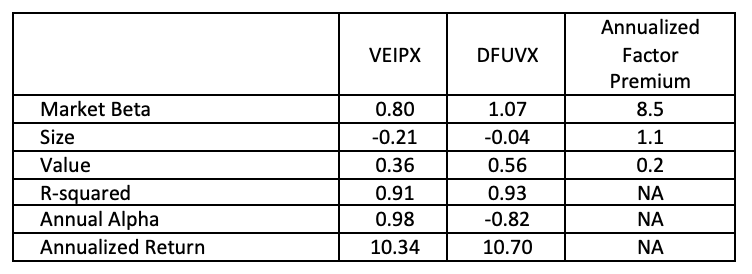
We’ll compare the returns, loadings on factors, and alphas for two funds from the same asset class (U.S. large value): the actively managed Vanguard Equity Income Fund (VEIPX) and the passively managed (rules-based and systematically implemented) DFA U.S. Large Cap Value III Portfolio (DFUVX). (Full disclosure: My firm, Buckingham Strategic Wealth, recommends Dimensional funds in constructing client portfolios.)
The data is for the longest period we have available, March 1995 through October 2021. The factor loadings and returns come from Portfolio Visualizer and use the Fama-French benchmark factors and the three-factor model. The factor premiums are also from the same site.
 For illustrative purposes only.
The r-squared figures are high, indicating that the model is doing a good job of explaining returns. While VEIPX produced a positive annual alpha of 0.98% and DFUVX produced a negative alpha of -0.82% (a difference of 1.80%age points), DFUVX provided a 0.36 percentage point higher return.
The reason for the outperformance is clear: DFUVX had much higher loadings on factors that delivered premiums. This allowed DFUVX to overcome the 1.80 percentage points difference in alpha.
While alpha is nice, you only get to spend returns. Thus, it is important to consider all these issues, including turnover, expense ratios and loading on factors.
Larry Swedroe is the chief research officer for Buckingham Strategic Wealth and Buckingham Strategic Partners.
For informational and educational purposes only and should not be construed as specific investment, accounting, legal, or tax advice. Mentions of specific securities including VEIPX and DFUVX are for illustrative purposes only and should not be construed as a recommendation of securities. Past performance is historical and does not guarantee future results. Investing involves risk. Certain information is based upon third party data which may become outdated or otherwise superseded without notice. Third party information is deemed to be reliable, however its accuracy and completeness cannot be guaranteed. By clicking on any of the links above, you acknowledge that they are solely for your convenience, and do not necessarily imply any affiliations, sponsorships, endorsements or representations whatsoever by us regarding third-party websites. We are not responsible for the content, availability or privacy policies of these sites, and shall not be responsible or liable for any information, opinions, advice, products or services available on or through them. The opinions expressed by featured authors are their own and may not accurately reflect those of the Buckingham Strategic Wealth® or Buckingham Strategic Partners®, collectively Buckingham Wealth Partners. Neither the Securities and Exchange Commission (SEC) nor any other federal or state agency have approved, determined the accuracy, or confirmed the accuracy of this article. LSR-22-196
Membership required
Membership is now required to use this feature. To learn more:
View Membership BenefitsSponsored Content
Upcoming Virtual Events View All


