Advisor Perspectives welcomes guest contributions. The views presented here do not necessarily represent those of Advisor Perspectives.
“Sequence of returns” (which I’ll refer to as SoR) and the associated risk of how they affect retirement withdrawal plans are a common subject of discussion. SoR entails the risk, with respect to retirement withdrawals, of running out of money before the end of the retirement span. If you go to www.YouTube.com and search for “sequence of returns,” you’ll find some excellent videos that explain the concept.
Unfortunately, there is little mention of how to avoid SoR risk. You will find things like “guard rail” systems and other methods that try to react to market changes, but they are arbitrary and hard to follow. Plus, they only try to reduce the risk and don’t necessarily avoid it.
It turns out, however, that SoR Risk can totally be avoided. It entails using the doublebucket® (DB) method. Instead of trying to avoid running out of money, the DB method drains down exactly to zero at the end of the retirement span. It does so by starting with an aggressive asset mix that slowly becomes more conservative until it only has cash in the last year or two. In that way, it guarantees that principal will never run out. If 30 years is too short, you can extend it to 35 years or more. The method doesn’t care; it will do the math based upon your time frame. Extending the time frame does mean that withdrawals will be less; but surprisingly, it will not be as much as you might think. That’s because the funds used to finance those latter years can be in higher risk investments, which cost little in today’s dollars.
As the name suggests, the DB method uses a bucket system to organize the funds and a moving asset allocation table to determine yearly rebalancing. Since the time frame is deterministic, a mathematical formula can be used to establish a yearly withdrawal rate and asset allocations. History has shown that roughly 90% of past 30-year spans (since 1972) can sustain a 5-6% withdrawal rate. In the other 10%, the average withdrawal rate was still above 4%. These impressive rates can be achieved because the method takes full advantage of capital as it drains down to zero. As you would expect, avoiding a risk has consequences. In the case of the DB method, avoiding SoR risk results in variable withdrawals as they go up and down with market performance. For those retirees who want a guaranteed withdrawal rate, the DB method may not be the most advantageous. However, for those that want to optimize their spending (beyond 4%) and don’t necessarily need to leave an estate, the DB method would be the best choice.
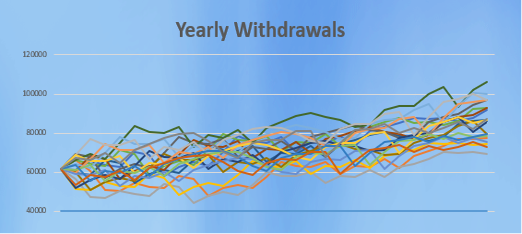
The following graph shows the yearly withdrawal amounts for the DB method on an initial principal of $1 million. Each colored line shows the yearly inflation adjusted withdrawal over a 30-year span. There are 20 different lines representing the time spans starting with 1972-2001 up to 1991-2020. The initial withdrawal starts around $60,000 and goes up and down from there, but in no case was the yearly withdrawal below $40,000 (i.e., the 4% rule).
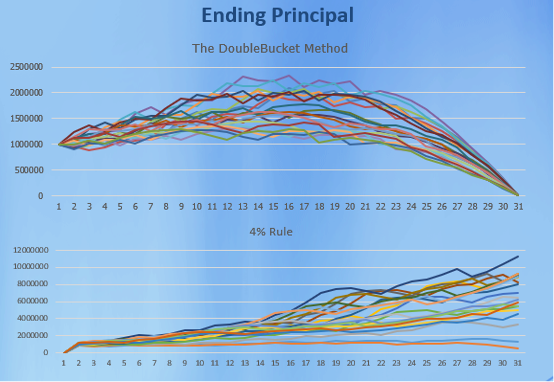
This next graph shows the ending principal after each year of the span for the DB method versus the 4% rule. Each span starts with $1 million. The DB Method builds principal in the middle years and then drains down to zero at end. The 4% rule, on the other hand, has a wide disparity in ending principal.
In full disclosure, I do have an involvement in the DB method, but as a partner, not a developer. A mathematician named Craig Pedersen developed the method and I happened to discover it and fell in love with the concept. I provided Pedersen with my experience in the financial industry to smooth out the curves. This is purely a research project developed to provide an alternative to the 4% rule. For more details, please see the full research paper on the DB method along with a paper on the general concepts of SoR:
Charles Fulmer, CFP®, is based out of Tampa and is retired. He previously worked at Fidelity Investments as fixed income specialist.
 Advisor Perspectives welcomes guest contributions. The views presented here do not necessarily represent those of Advisor Perspectives.