How do taxes impact the 4% rule for retirement spending? Most research on sustainable withdrawal rates assumes spending is either from a tax-exempt account such as a Roth IRA or a tax-deferred account such as a traditional IRA. In the latter case, spending is assumed to be gross of taxes, as any taxes due must be paid from the distributions.
For a taxable account, sustainable spending rates are negatively impacted by the need to pay ongoing taxes for interest, dividends, capital gains distributions, and realized net capital gains when assets are sold or rebalanced. These taxes reduce the potential for compounding growth.
Because individual tax rates vary greatly, as do interest and dividends supported by the portfolio and the cost basis of the taxable account, it is impossible to create one general number for a sustainable after-tax spending rate from a taxable account. It is even harder to speak generally about the impact of taxes because retirees will enjoy tax diversification between multiple account types.
Ultimately, the way to manage this tax issue is not necessarily to determine its impact on a sustainable withdrawal rate, but to test the circumstances of one’s spending plan with a more complete model that accounts for taxes in additional to after-tax spending goals.
While I cannot provide a generalized analysis to show the impact of ongoing taxes on sustainable spending, basic estimates show that the impact can be substantial. I will provide simple estimates of the impact that taxes can have on sustainable retirement spending with nine different case studies that involve having a differing amount of assets in either a taxable, tax-deferred, or tax-exempt account, with portfolio return assumptions that support 4% as a sustainable initial spending rate if taxes did not apply.
Federal income taxes will be calculated for portfolio distributions, the taxation of Social Security benefits, adjustments to Medicare premiums, and the net investment income surtax. I will estimate how much the after-tax distribution must be reduced compared to a no-tax scenario, to find the inflation-adjusted after-tax distribution strategy that is able to support required tax payments.
Case study details
This case study is for a 65-year-old couple with a 30-year retirement horizon. Assets include an investment balance and annual Social Security benefits of $42,000. The sustainable level of portfolio distributions is measured net of tax, assuming 2022 tax laws and no state income tax. Dollar amounts are provided in real age-65 dollars, and annual cost-of living adjustments assumed to match the consumer price index are applied in all cases to Social Security and the sustainable after-tax spending amount.
Inflation is 2.5% (meant to be a long-term projection rather than reflecting 2022 inflation numbers) and the real investment return above inflation is 1.31%, for 3.81% overall. This is a fixed return assumption that is treated as interest, which means it is taxed as ordinary income for a taxable account. Though the 4% rule is based on historical market returns, this fixed investment return calibrates the cash flows supported by the 4% rule with a simple fixed return for a 30-year retirement.
To create nine scenarios, the couple has either $1 million, $2 million, or $3 million of investment assets entirely held in either a taxable, tax-deferred, or tax-exempt account.
The couple must pay federal income taxes – an additional expense that will be estimated and added to their after-tax sustainable spending. I calculate taxes using interest from the taxable account, the ordinary income generated from tax-deferred distributions, the precise amount of taxes due on Social Security benefits, any Medicare premium surcharges if modified AGI exceeds the relevant thresholds, as well as any potential net investment income surtaxes due. These taxes are calculated based on the tax law in 2022, including the shift to higher tax rates in 2026 that is part of the sunsetting provisions in current law, as well as the new required minimum distribution (RMD) life tables introduced in 2022. Tax brackets increase with inflation, though the thresholds for determining taxes on Social Security and the net investment income tax are not inflation adjusted. This couple uses the standard deduction instead of itemizing.
Results
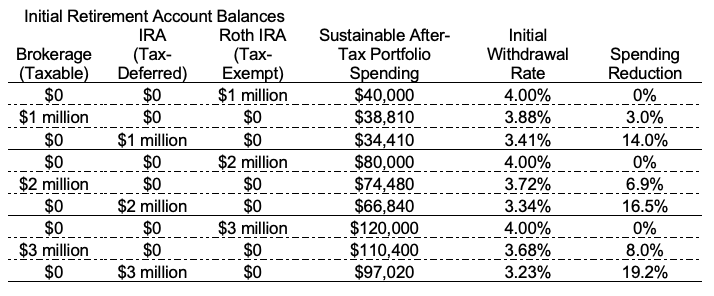
Exhibit 1 provides the main results for the investigation. It shows the sustainable amount of after-tax portfolio distributions for each case. The initial withdrawal rate is calculated as the sustainable after-tax portfolio spending amount divided by the initial portfolio balance. Total household after-tax spending adds the $42,000 Social Security benefit to the portfolio distribution amount. The household will also need to pay any federal income tax due. After-tax spending amounts increase with inflation.
Exhibit 1
Sustainable After-Tax Spending for Different Retirement Portfolio Scenarios
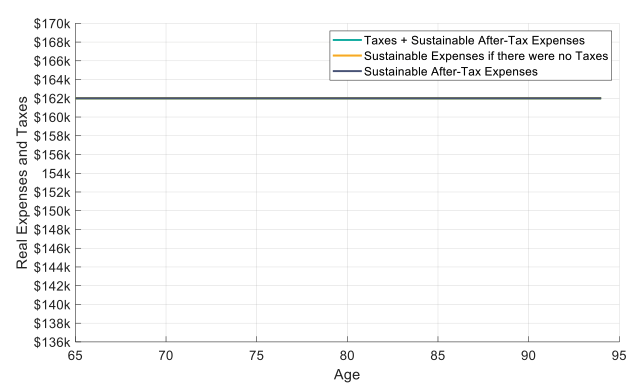
If all assets are held in a tax-exempt Roth account, the only source of taxable income is a portion of the Social Security benefit. Its taxable portion never rises to the level of the standard deduction, and there will not be any taxes due. The full 4% distribution rate can be spent in after-tax terms for all three initial portfolio balances. Exhibit 2 provides a visual of this for the $3 million case, in which there are no taxes, such that the sustainable spending with and without taxes is the same. Thus, all three lines in exhibit 2 are identical.
Exhibit 2
Retirement Spending for Scenario with $3 million in a Tax-Exempt Roth IRA
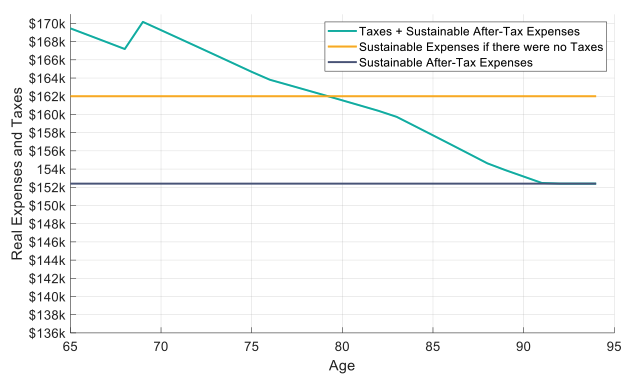
Next, consider the taxable account numbers from Exhibit 1. Since there are taxes to be paid, this discussion gets more interesting. For a $1 million taxable account, the sustainable after-tax spending rate drops by 3% to 3.88% to allow enough remaining assets to cover the tax bills. With $2 million, the drop is 6.9% to 3.72%, and with $3 million the drop is 8% to 3.68%. Exhibit 3 provides a visual for the case with $3 million in a taxable account. The after-tax portfolio distribution is $110,400, for a total of $152,400 with Social Security benefits included. Spending without any need to pay taxes could be $162,000. The cyan curve shows the total spending with taxes and the sustainable after-tax amount. Naturally, taxes are not fixed in inflation-adjusted terms. They decline as the portfolio is spent down. The jump at age 69 reflects the change to the inflation-adjusted 2017 tax brackets as the Tax Cuts and Jobs Act (TCJA) expires. By age 91, remaining assets and interest has fallen by enough that even with the taxable portion of Social Security, taxes are not due after accounting for the standard deduction.
Exhibit 3
Retirement Spending for Scenario with $3 million in a Taxable Brokerage Account
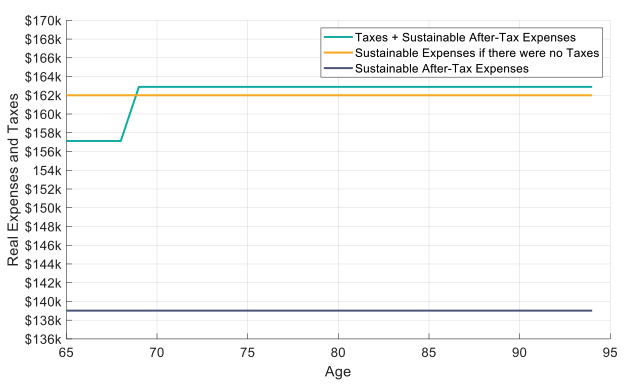
Finally, a tax-deferred account has the largest overall tax impact. For a $1 million tax-deferred account, the sustainable after-tax spending rate drops by 14% to 3.41%. With $2 million, the drop increases to 16.5% for a 3.34% after-tax distribution rate. The drop with a $3 million tax-deferred account is 19.2%, with a net spending rate of 3.23%. Exhibit 4 provides the corresponding visual for $3 million in a tax-deferred account. In this case, required minimum distributions are not binding. For Social Security, 85% of the benefit is consistently taxable, and the IRA distribution is consistent in inflation adjusted terms. This does lead to constant inflation-adjusted taxes over time, with an exception for the discrete tax increase at age 69 when the TCJA sunsets. Prior to 2026, the income generated consistently enters the 22% tax bracket, and then it is in the 25% tax bracket for 2026 and later.
Exhibit 4
Retirement Spending for Scenario with $3 million in a Tax-Deferred IRA Account
The bottom line
Taxes have an important impact on the sustainability of the 4% rule. I have provided nine examples to show the tax impact with differing amount of assets in different account structures for a given level of Social Security benefits. Roth IRAs are naturally the most attractive account to draw from in retirement because this income is not taxable. For the taxable account, the impact on after-tax spending ranged from 3% to 8% as the investment account increased from $1 million to $3 million. For a tax deferred account, the reduction to after-tax sustainable spending ranged from 14% to 19.2% as the tax-deferred account increased from $1 million to $3 million. These are simple examples meant to provide readers with a sense about how taxes can impact the 4% rule, which traditionally did not incorporate taxes into its assumptions.
The goal of constant inflation-adjusted spending in retirement is presumably meant to be an after-tax objective. But constant inflation-adjusted taxes will not be a reality for most retirees, meaning that the starting premise of the 4% rule is even less applicable in real life than commonly presumed. Even with the incredibly simplified cases examined here, constant pre-tax spending will not translate into constant after-tax spending.
Wade D. Pfau, Ph.D., CFA, RICP®, is the program director of the Retirement Income Certified Professional® designation and a Professor of Retirement Income at The American College of Financial Services in King of Prussia, PA, as well as a co-director of the college’s Center for Retirement Income. As well, he is a Principal and Director for McLean Asset Management and RISA, LLC. He also serves as a Research Fellow with the Alliance for Lifetime Income and Retirement Income Institute. Wade’s latest book is Retirement Planning Guidebook: Navigating the Important Decisions for Retirement Success.
Read more articles by Wade Pfau
 How do taxes impact the 4% rule for retirement spending? Most research on sustainable withdrawal rates assumes spending is either from a tax-exempt account such as a Roth IRA or a tax-deferred account such as a traditional IRA. In the latter case, spending is assumed to be gross of taxes, as any taxes due must be paid from the distributions.