Advisor Perspectives welcomes guest contributions. The views presented here do not necessarily represent those of Advisor Perspectives.
We would like to thank Rob Arnott, Aswath Damodaran, Richard Gerger, and Jason Hsu for helpful comments on topic of of this paper.
In this short note, we introduce a tool for assessing how the market responds to news about the economy and about government monetary and fiscal policy. The tool is a 60-trading day rolling correlation between percentage changes in ten-year Treasury bond yields and returns on the S&P 500 index as a proxy for the market. We find that 60-days is an ideal length for estimating the rolling correlation because it balances having enough observations to reduce noise and be statistically significant while still being responsive to short-term changes in market conditions.
To begin, note that if the unexpected innovations in economic activity were the main force driving changes in Treasury yields and changes in stock prices then one would expect the two changes to be positively correlated. For instance, suppose that new information arrives which indicates that economic growth will be greater than previously anticipated. In that case, both Treasury yields and stock prices should rise because a stronger economy increases the demand for credit and spurs corporate profits. Conversely, if the new information indicated slowing growth, presumably both yields and stock prices would fall, again leading to a positive correlation. However, if the markets were responding to other forces, in particular government monetary and fiscal policy, then the correlation could be quite different.
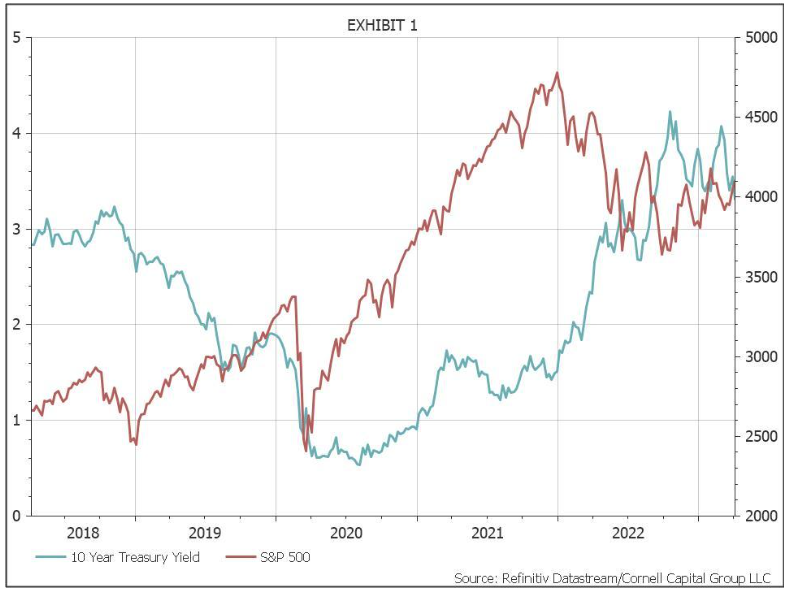
Before turning to the rolling correlation, it is useful to have available background data on the levels for both variables. Therefore, Exhibit 1 plots the yield on ten-year Treasury bonds along with the level of the S&P 500 for the five-year period from April 6, 2018 to April 6, 2023. Both these time series are well known and require no further elaboration.
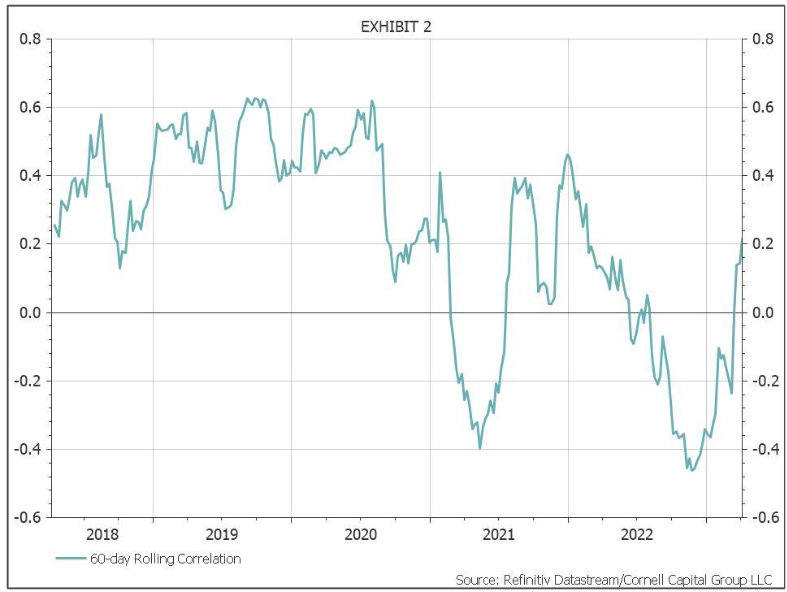
Exhibit 2 plots the rolling 60-trading day correlation between the percentage change in the yield on 10-year Treasury bonds and returns on the S&P 500 stock index over the same five-year period. Note, the first observation is June 30, 2018, because 60 trading days are

required to compute the correlation. For the first two plus years following June 30, 2018, the correlation is positive as predicted. Although the correlation is volatile, not surprising given the volatility of stock prices, it oscillates around a mean of about 0.40 which is quite high for daily data.
The first major decline in the rolling correlation begins in early 2021. The correlation plunges all the way to -0.40 by June 2021. It then recovers rapidly exceeding 0.40 by the end of 2021. At that point, the correlation collapses again. It falls throughout most of 2022, and drops
below -0.40 by early December 2022. It then starts rising rapidly reaching 0.20 by the end of the sample period in April 2023.
Given the behavior of the rolling correlation, the obvious question is what caused the two drops and subsequent recoveries? In our view, the answer is government policy, particularly the impact of the Federal Reserve. The story as we see it is as follows.
Looking back at Exhibit 1 reveals that as the stock market boomed in 2021, interest rates, after an initial increase, actually fell. That pattern cannot be due to fiscal stimulus because added government borrowing leads to rising rates. The answer must be monetary policy. That hypothesis is consistent with two major policy steps taken by the Federal Reserve. First, despite the growing economy, and near record low unemployment, the Fed kept its target interest rate pegged in a range of 0.00% to 0.25%. Second, the Fed continued purchasing large amounts of government bonds and mortgage-backed securities, thereby preventing the record government deficits from causing bond prices to fall. The combination of those two steps broke the normal correlation between changes in stock prices and changes in interest rates.
Once the markets had adjusted to the new Fed stance of pursuing an aggressively expansive monetary policy, the positive correlation reemerged. Throughout 2021 the Fed stuck with its loose monetary policy. It did so despite the fact that many economists, led by Larry Summers, were concerned that this policy was bound to lead to inflation, a view expressed by the Cornell Capital Group on numerous occasions. Even as inflation began to accelerate at the end of 2021, the Fed stuck with its expansionary monetary policy arguing that the inflation was transitory. Then, after it became clear that the growing inflation was not transitory, the Fed dramatically reversed course. Between March 17, 2022 and March 23, 2023 it raised its interest rate target 9 times from 0.00-0.25% to 4.75-5.00% and began to sell some of its bonds and mortgage-backed securities. The result was an increase in interest rates across the yield curve, particularly at the short end. The rising interest rates were bad news for stock prices. Between March 2022 and March 2023, the S&P 500 fell 9.3% percent while the ten-year Treasury yield rose 200 basis points. It is no surprise that the rolling correlation turned sharply negative. Once again though, the duration of the negative correlation was limited. In late December 2022, the correlation began to rise. By the end of the sample period on April 6, 2023, it was back to 0.20. This suggests that the market is returning to “normal” when news regarding economic activity is the main driver of changes in bond yields and stock prices. Movements in both appear to be based on evolving investor views regarding the likelihood of a recession and its depth.
Whether or not one accepts our explanation for the behavior of the rolling correlation, the usefulness of the tool for assessing the behavior of the market remains. A pronounced shift in the correlation is akin to a diagnostic test revealing that something fundamental has changed. This makes tracking the rolling correlation and attempting to understand its behavior a useful undertaking for investors.
Bradford Cornell is a professor of finance at the Anderson Graduate School of Management, UCLA, and a senior advisor, Cornell Capital Group. Shaun Cornell is president and Andrew Cornell is vice president of Cornell Capital Group, respectively.
Read more articles by Bradford Cornell, Shaun Cornell and Andrew Cornell