You Are Underestimating Longevity… and How Uncertain It Is
Membership required
Membership is now required to use this feature. To learn more:
View Membership Benefits Advisor Perspectives welcomes guest contributions. The views presented here do not necessarily represent those of Advisor Perspectives.
During those tense days of March 2020, lockdown robbed one of us (Massimo) of the chance to celebrate his grandmother’s 100th birthday in person. Most of the family thought we would never get to see her again.
Luckily, we were wrong. She turned 103 last March and passed away peacefully surrounded by relatives a month later.
A picture of Massimo’s grandmother, from the 1940s when she was in her 20s

“Centenarians” are becoming more and more common. There are approximately 90,000 people in the U.S. who are over the age of 100, double the number in 2008. In stark contrast, headline life expectancy has fallen to 76 due to COVID-19 and other factors (technically, this is period life expectancy at birth). How should advisors make sense of these seemingly contradictory trends? How long should they plan for the clients to live?
How long should financial advisors plan for their clients to live?
Most financial advisors plan for their clients to live to 90 as a conservative estimate. But here is a longevity estimate for a healthy 65-year-old retired couple (Figure 1):
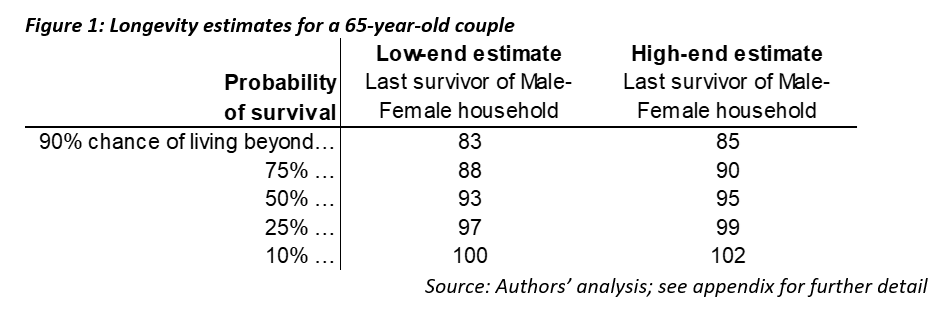
Three things stand out to us:
1. Planning to 90 is not conservative: There’s a 50% chance one member of a couple will live past 93 under the low-end estimate, and a 75% chance one will live beyond 90 under the high-end estimate.
2. Any single, fixed time horizon is likely to be wrong: Variation in lifespans is large. The low-end estimates indicate that 10% of 65-year-old couples won’t survive a 20-year time horizon; but another 10% will see one member live beyond 100, a 35-year time horizon.
3. The estimates themselves vary a fair amount: At each probability, there is a two- to three-year difference in age between the low-end and high-end estimates. Differences in methodologies and assumptions create another source of uncertainty.
How much can we trust these estimates?
When we hear that the average life expectancy is 76, this biases us to think that age 90 is a conservative assumption. But 76 is the average life expectancy at birth for the average American, based on data from 2021. Five key issues make this a poor estimate for the lifespan of clients of financial advisors:
1. Older people have already avoided a lot of risks: Headline life expectancy is life expectancy at birth. To estimate someone’s lifespan, the right number to use is life expectancy conditional on living to their current age. This number is much higher for people in their 60s because, by definition, they have already avoided dying for 60+ years!
2. It’s an average, not a “stressed” scenario: Headline life expectancy is an average, not a ‘bad’ scenario. If financial planners want to be more like Jack Reacher and “hope for the best but plan for the worst,” they should understand the distribution of lifespans, not just the average.
3. One of two people will survive longer than just one: Headline life expectancy is for individuals, not couples. Most people in their 60s are married, and most couples want to plan for the last surviving member, rather than individually. Combining the longevity prospects of two people leads to longer planning horizons.
4. Medical advances extend longevity over time: Headline life expectancy uses current mortality data, i.e., last year’s death rates for people of different ages in the U.S. To project lifespans over the coming decades, we need assumptions about how much further life will be extended in the future.
5. Wealthier people have higher life expectancies: Headline life expectancy is based on the mortality of all Americans. In contrast, clients of financial advisors are people with some level of financial wealth. People with even modest levels of financial assets appear to live significantly longer than the national average.
The first three issues are solved using “life tables” from the Social Security Administration (SSA) (Figure 2). The average 65-year couple in the U.S. has a significant chance of making it well into their 80s, especially women. They have a 50% chance of one member making it age 89.
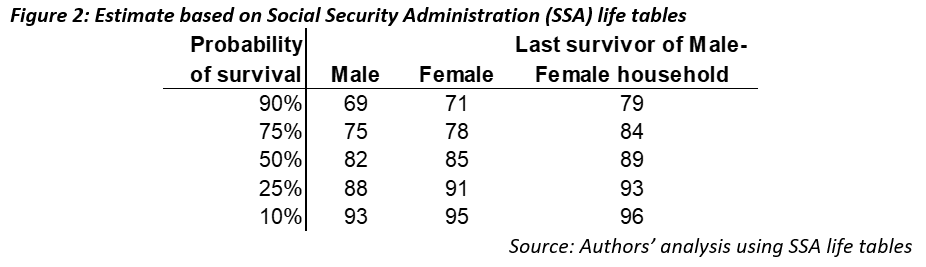
But SSA life tables do not consider the potential for future improvements in mortality (issue #4) or the effect of wealth on longevity (issue #5). While there are no perfect answers to these questions, we will show a range of estimates based on a few data sources and methodologies.
Behind the numbers: Wealth is health
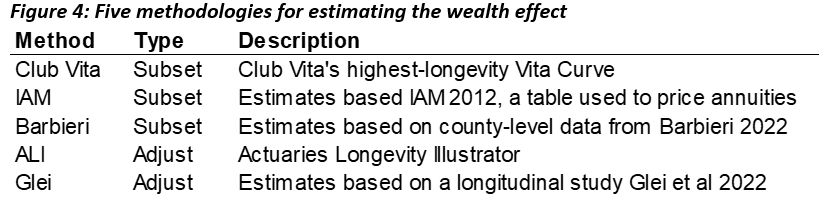
To estimate lifespans for people like the clients of financial advisors, there are two basic methodologies.
One is a data-driven approach that looks to measure mortality for a subset of the population. Pension funds are the main source of data for this approach because they maintain detailed mortality statistics that allow us to isolate a subset of the population that has similar characteristics to the clients of financial advisors.
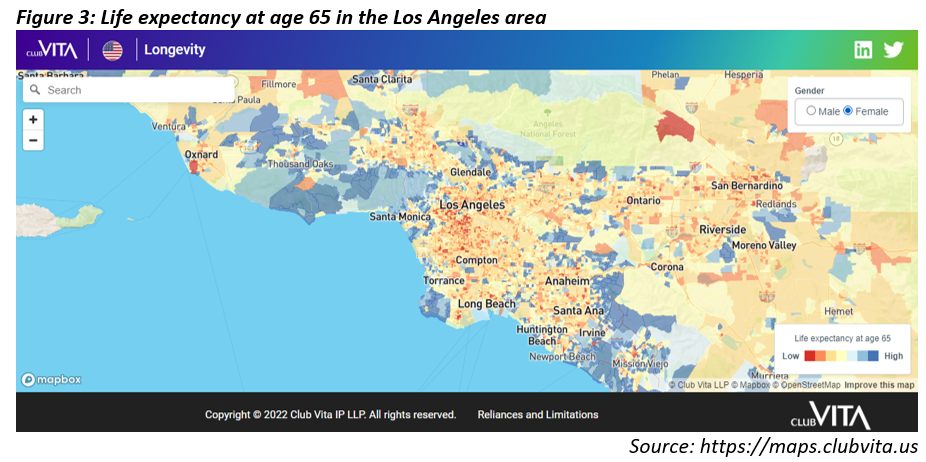
For example, Club Vita (where one of us, Erik, is an actuary and head of content), maintains a dataset on mortality information for pension plan participants across the U.S. Club Vita augments this data with several additional factors that can be used to capture differences in expected lifespan between different subsets of the population, including Zip+4, pension benefit amount, and various features of the pension plan. Zip+4, on average, contains about 20 households, so these datasets can be used to capture localized “neighborhood” effects on mortality.
Here's a map of LA, color-coded for life expectancy at age 65 using Club Vita’s VitaCurves model (Figure 3). An interactive version of this map is available on Club Vita’s website.
The other methodology is to adjust the national average. This approach starts with the national average (i.e., SSA life tables), and then adjusts for the effect on mortality of different characteristics like wealth, health, or smoking status. For example, this is the approach the Society of Actuaries (SOA) took to develop the Actuaries Longevity Illustrator.
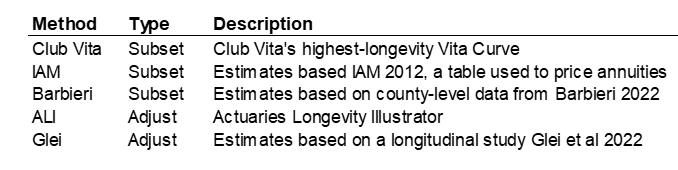
In this article, we use five different approaches to show a range of estimates. See the appendix for details on each methodology.
Behind the numbers: Will medical science keep improving longevity?
The other key factor to incorporate is “mortality improvements” – how much we expect mortality to improve in the future at each age due to medical advances and other factors.
I recently asked an actuary at the SOA how much agreement there was about how to estimate these future improvements in mortality. She did not hesitate: “This is a raging debate.” This is understandable, since projecting future mortality improvement is an attempt to predict the progress of medicine, public health, and other complex factors that impact longevity.
One standard that has emerged in the U.S. is the improvement scale created by the SOA. The latest version is referred to as “MP-2021.” This approach blends data-driven projections for near-term improvement rates into long-term rates judged to be sustainable by experts in the field. The improvement rates vary by age, sex and year, but are in the range of 0% to 1.2% per year. Other approaches lead to different answers. For example, improvement scales used in the UK are generally higher, and max out at about 1.5% per year.
Applying these rates can significantly reduce mortality rates. For example, the probability of an 80-year-old woman dying in 2019 was 2.7%. For someone who will be 80 in 2034 (i.e., a 65-year old today), “MP-2021” improvement rates imply a 2.3% probability of dying that year (a ~15% reduction).
Wealthier people will likely benefit more from future improvements compared to the general population. A good amount of evidence points in this direction. For example, Club Vita research indicates that people with pensions – typically higher salaried employees than the average – have seen around 0.8% higher improvements per year than the general population in recent years.
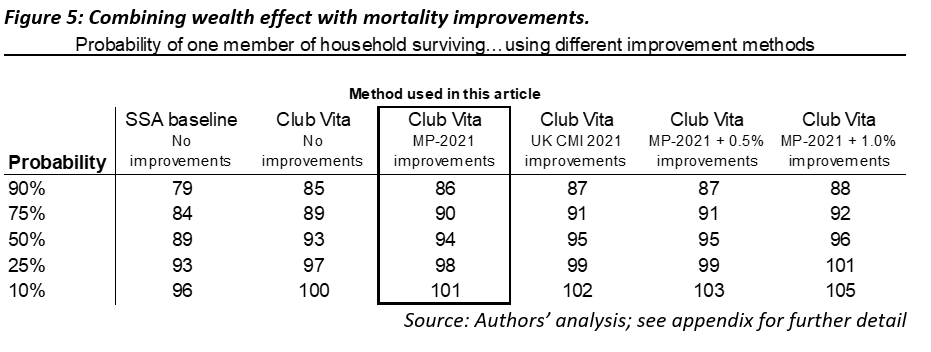
Figure 5 shows both the impact of wealth and mortality improvement assumptions. The choice of improvement assumption matters, but not as much as the wealth effect.
Putting it all together
Overall, the different methodologies point in the same direction: healthy, wealthy 65-year-old couples have good chance of experiencing longer than 30-year time horizons (i.e., to age 95 and beyond). Age 90 is not a conservative choice anymore; there is roughly a 75% likelihood that one member of a couple live will beyond that age.
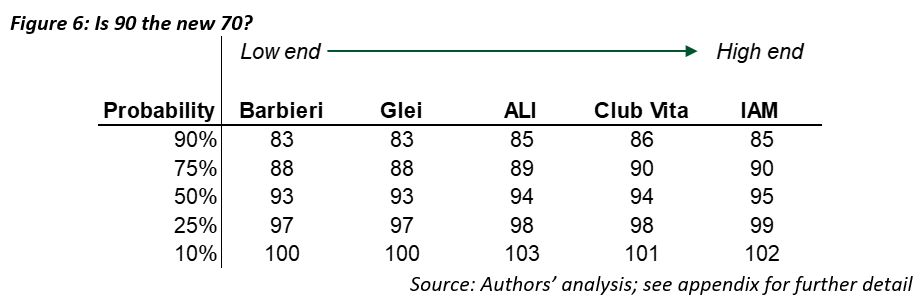
Although the results are broadly similar, the different methodologies produce a range of estimates, and differences of a few years are meaningful in a planning context.
Conclusion
Many advisors are using longevity assumptions that are less conservative than they think. For example, age 90 is likely to undershoot lifespans for many clients, especially healthy couples.
That said, lifespans are highly uncertain. Even if you think a particular methodology is the right one, as we all know, individuals can outlive or underlive that prediction. On top of that, there is the added uncertainty of which of the underlying methodologies is correct.
One approach is to pick a lifespan assumption based on each client’s situation, rather than using a blanket assumption like age 90.
This requires choosing a methodology or tool and a probability. Advisors could choose a more conservative probability, like 10% or 25%, as Wade Pfau has suggested. Of course, this means lower spending in probability-based retirement strategies. On the other hand, more conservative longevity assumptions interact with Monte Carlo assumptions, so choosing conservative lifespan assumptions may lead to advisors being even more conservative than they intend.
To sidestep this issue, advisors could use insurance products or other risk-pooling solutions to eliminate this issue. For example, “pure” longevity-hedging solutions like deferred-income annuities eliminate the issue of longevity by providing guaranteed income for life, while consuming a relatively small portion of a client’s investment portfolio.
Massimo Young, CFA is head of investment solutions and technology for the Individual Retirement Solutions group at Insight Investment.
Erik Pickett, PhD, FIA, CERA, is actuary and chief content officer at Club Vita.
Appendix: The 5 Methodologies
Barbieri
This method is based on county-level mortality data in Barbieri 2022. The data is grouped into 10 deciles according to an index of socioeconomic factors about the underlying counties. We used the highest-ranked socioeconomic decile for this analysis.
We then added improvements using MP-2021.
Glei
This method is based on a longitudinal study by Glei et al. 2022. The study concluded that the probability of an individual with no assets surviving from age 65 to 85 was just 40%; for a person with at least $300,000, the probability rose to 71%. Of course, wealth itself is not the whole story: wealth is correlated to many other things that impact longevity, like health and education. However, for our purposes, a wealth effect that also captures other correlated factors is sensible: if the only thing we assume about a client is they have some wealth (as all clients of financial advisors do), it is reasonable to use an unconditional wealth effect.
We adjusted SSA tables (without improvements) to match the 71% probability of survival for an individual (average of male and female) by decreasing mortality by 23% in each year through age 85. After age 85, we linearly decreased the wealth effect from 23% down to 0% by age 100. The 23% was determined via trial and error to reach a wealth effect that would produce a 71% probability of survival for an individual (average of male and female) from age 65 to 85.
We then added improvements using MP-2021.
Club Vita
This method is based on a Club Vita’s proprietary Zip Code+4-level data, which includes mortality statistics from pension funds in the U.S. More detail about the base curves is available here. For this analysis, we used the longest-lived grouping of Zip+4, the highest pension income band, white collar participants, and retirees in “normal health” (not disabled).
We then added improvements using MP-2021.
ALI
This method is based on a the Actuaries Longevity Illustrator (ALI), a free online tool provided by the American Academy of Actuaries and the Society of Actuaries. The basic methodology of this tool is to use SSA tables and adjust them for 2 factors, overall health and smoking status, and then apply MP-2021 improvements. More detail on methodology is available here.
For this article, we used output for a 65-year-old male-female couple, in which neither smoke and both are in “Excellent” health. While smoking and health are correlated to wealth, of course there are many exceptions. Arguably, using the ALI may underestimate the effect of wealth, since it does not separately account for the effects of wealth beyond smoking and general health.
IAM
This method is based on the IAM 2012 mortality tables for males and females. These mortality tables are based on the mortality experience of people with immediate annuities, annuitizations and life settlement options of individual life insurance and annuity death claims between 2000 and 2004. People with these annuities likely have some level of wealth, and they also likely self-select into annuities because they are healthier than the average.
We projected the 2012 data forward to 2019, using actual improvements in mortality (from SSA) between 2012 and 2019, and then added improvements using MP-2021.
Membership required
Membership is now required to use this feature. To learn more:
View Membership BenefitsSponsored Content
Upcoming Virtual Events View All


