Behavioral Measures of High Confidence Cash Flow
Membership required
Membership is now required to use this feature. To learn more:
View Membership Benefits Advisor Perspectives welcomes guest contributions. The views presented here do not necessarily represent those of Advisor Perspectives.
Company cash flow is the essential determinant of a stock’s value. Strong, consistent cash flow is essential for identifying attractive dividend and defensive stocks alike. Growing cash flow, either actual or expected, is the growth stock’s accelerant. When it comes to valuing stocks, cash flow is king.
The typical method for estimating future cash flow is to gather a company’s financial information, along with an analysis of future product market prospects and, using this collective data, generate a set of cash flow projections. This approach is employed by a wide range of analysts and investors.
In this article, a behavioral approach is taken to determine if there is high confidence in a company’s cash flow estimates. Each of the behavioral indicators employs a “put your money where your mouth is” measure that provides a reward if correct and a penalty if wrong. These are the most useful types of indicators, as there is incentive to avoid overstating the confidence in company cash flow. Collectively, they can signal strong underlying fundamentals.
High Confidence Cash Flow
In order to gauge cash flow confidence, three “put your money where your mouth is” measures are employed, each providing a level of protection against overstating cash flow confidence.
Each of these measures is commonly used in stock analysis. However, rather than using them as a measure of financial condition, each one mentioned in this article sheds light on the level of cash flow confidence. In other words, rather than attempting to directly estimate future cash flow, the analysis switches to those participants who have a strong incentive to carefully estimate future cash flow.
Three financially involved company participants are the focus: company management, sell-side analysts, and credit analysts.
- Management Cash Flow Confidence: Company management regularly issue announcements regarding the current state of the company as well as its future prospects. These are often in the form of press releases, discussions with the press and investment analysts, and earnings calls. The problem is that there is little downside risk for misleading statements, so such statements are prone to overstating the true condition of the company.
Dividends are another matter. When a company declares a dividend, management is making a financial commitment to its shareholders, now and into the foreseeable future, that cash flow will be sufficient to maintain the dividend.
Initiating a dividend payment usually leads to a share price increase. On the other hand, there is considerable downside risk, in the form of an often-steep share price decline if dividends are reduced or suspended. Thus, dividends are a reliable indicator of management cash flow confidence as there is a financial reward for honesty and a financial penalty for misrepresentation.
- Analyst Confidence: Sell-side analysts, who are generally employed by large brokerage firms, carefully analyze the stocks they follow, producing detailed earnings and cash flow projections for each company. The resulting collective forward P/E ratio provides significant information regarding the relationship between current stock price and expected company cash flow.
A stock with a forward P/E that does not exceed an upper bound is a measure of analyst confidence, signaling future earnings — and by extension future cash flow — are sufficient to justify the stock’s current price. Put another way, sell-side analysts are collectively indicating, through their detailed earnings analysis, that the stock price is attractive relative to underlying fundamentals.
Studies show that sell-side analysts provide valuable information for making stock investment decisions. Recommendations made by buy-side analysts, who are employed by equity mutual funds and other institutional investors, have been shown to be even more informative. However, unlike the sell side, buy-side recommendations are not made public, even if they can be inferred through an extensive analysis of fund holdings (See Frey and Herbst). Thus, the sell side rather than buy side is used for measuring analyst cash flow confidence.
- Creditor Confidence: Debt is generally perceived negatively by investors. This opens up a behavioral mispricing opportunity when a company’s debt is incorrectly viewed as being risky. Many companies easily meet their debt obligations, but investors still often react negatively to a large debt obligation.
A high debt-to-asset ratio indicates the company is funding a substantial portion of its needs using debt rather than equity. Creditors only lend if they believe they will be repaid. So, a high debt ratio is a sign that creditors have a great deal of confidence in the company’s future cash flow.
It is interesting to note that equity analysts pay close attention when credit analysts provide their take on the company’s financial situation. This is because creditors face no additional upside when the company does well, other than the repayment of debt, but considerable downside risk if the company does poorly. The result is a more thorough picture of the risks faced by the company, as compared to the equity analyst’s emphasis on upside potential.
Note that creditor confidence interacts with management confidence. Debt instruments have covenants that most often require a company to reduce or suspend dividends if financial conditions deteriorate. So deteriorating creditor confidence can lead to the elimination of the management confidence signal as well.
Pure Valuation: High Confidence Cash Flow Case Study
For over 20 years, AthenaInvest has successfully managed the Pure Valuation stock portfolio, which employs the overall value/high confidence cash flow methodology described above.
Using minimum annual sales as a way to avoid hard-to-trade smaller stocks, the initial stock pool numbers about 2,500.
High-confidence cash flow alone does not signal a buying opportunity. On the other hand, high confidence cash flow combined with a preliminary undervaluation signal addresses this issue and provides a reliable measure of stock undervaluation.
Employing a preliminary valuation screen is a nod to value pioneers Graham and Dodd’s classic Security Analysis. First published in the depth of the 1930s Great Depression (how contrarian to advocate investing in stocks during some of the worst bear markets in history!), it remains essential reading for serious value investors. G&D not only championed the idea of investing in undervalued stocks but also attributed the existence of these opportunities to behavioral mistakes made by investors.
Of the frequently used valuation ratios, price to sales (P/S) has been identified in various studies (e.g. See Barbee et. al. and Nathan et. al.) as being the most reliable indicator of undervaluation.
Here is why P/S is considered a better indicator of company relative value:
- P/S is generally not distorted by accounting choices, such as the choice of depreciation method or inventory valuation method. This is because P/S is based on revenue, which is little affected by accounting choices.
- P/S is less affected by cyclicality because it is based on revenue, which is less volatile than other financial measures further down the income statement.
- P/S is more comparable across industries. This is because PS is not affected by differences in profitability among industries.
Stocks exceeding a maximum P/S are removed from the initial pool, resulting in a collection of potentially undervalued stocks.
The stocks within this pool satisfying the three cash flow criteria of dividend yield for management confidence, forward P/E for analyst confidence, and debt ratio for creditor confidence, are eligible for inclusion in the portfolio.
Two secondary criteria are as follows:
- An Alpha Life Cycle criterion, based on research conducted by Essentia Analytics, is applied.
- At least six of the 10–12 market sectors are represented in the portfolio, with no more than 30% of the portfolio in a single sector.
In order to avoid behavioral selling errors, Pure Valuation’s rules-based approach uses the same criteria for both buying and selling decisions. As a result, stocks are held an average of 18 months.
The chart below reports the sell reasons for 2015–2024.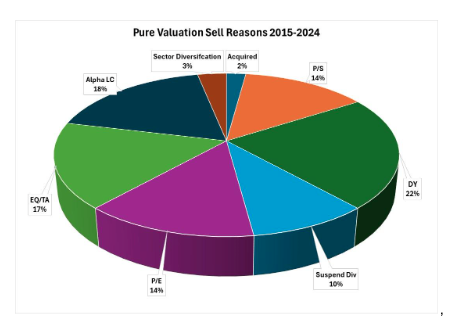
As can be seen in the chart, stocks were sold 14% of the time because they failed the P/S valuation criteria, while they were sold about two thirds of the time for failing one of the high confidence cash flow criteria. The remaining nearly one quarter of sells were the result of Alpha Life Cycle, sector diversification and acquisition reasons.
High Confidence Cash Flow Driven Superior Performance
High confidence cash flow has played a central role in the management of the Pure Valuation portfolio for the last 20+ years. Over this period the portfolio has generated long-term returns that far exceed those of its benchmark, the Morningstar U.S. Mid Value Index.
In addition, its returns exceed those reported for a portfolio managed based on P/S alone. Thus, high confidence cash flow provides a useful culling of the initial pool of potentially undervalued stocks.
Capturing the behavior of key company participants by means of “put your money where your mouth is” cash flow confidence measures, rather than directly estimating cash flow, is an attractive way to manage a stock portfolio.
C. Thomas Howard is the founder, CEO and Chief Investment Officer of AthenaInvest.
A message from Advisor Perspectives and VettaFi: Discover something new! Click here to register for our upcoming webcasts.
Membership required
Membership is now required to use this feature. To learn more:
View Membership BenefitsSponsored Content
Upcoming Virtual Events View All


