Advisor Perspectives welcomes guest contributions. The views presented here do not necessarily represent those of Advisor Perspectives.
In Morgan Housel’s book “Same as Ever: A Guide to What Never Changes,” he devotes a chapter to the power of storytelling. He notes, “Charles Darwin was not the first to discover evolution; he just wrote the most compelling book about it.” Similarly, when referring to Yuval Noah Harari’s bestselling book “Sapiens” (which has sold over 28 million copies), Housel cited Harari’s comment: “There is absolutely nothing there that is new. I’m not an archeologist. I am not a primatologist. I mean, I did zero new research … . It was really reading the kind of common knowledge and just presenting it in a new way.”
In much the same way, investment managers should recognize that the story of their strategies is shaped not only by results, but by how those results are framed and communicated.
A manager’s strategy is often defined by third-party evaluators such as Morningstar, which distills complex approaches into ratings, style boxes, summarized performance, and product profiles. While these represent useful reference tools for investors, they can also oversimplify or obscure the nuances of a manager’s philosophy and edge. This paper highlights and provides examples of how investment managers can reclaim and shape their own narrative by leveraging data science and alternative data sources, demonstrating the power in presenting information in new ways.
Investing is often viewed as a numbers game, which can downplay the importance of words in the investing process. The reality is that words matter, and advances in data science and industry classification systems have relied on words as a way of standardizing the codification of company business models to make them more precise.
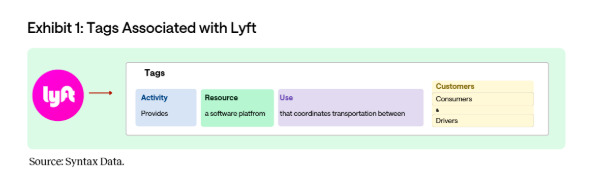
Take, for example, a structured alphanumeric tagging system that uses nouns and verbs as building blocks to describe a company. Exhibit 1 shows that combining activity and resource tags — these nouns and verbs — allows you to create entire sentences that describe a company. In a traditional classification system, a company like Lyft or Uber would be treated as an industrial company given its focus on transportation. A more accurate depiction, however, is that Lyft is a software company that provides services to the transportation industry.
The tags shown above are not limited to company-level data but can be applied to product lines and describe who the customer is, how its product is used, and dozens of other facets of the company’s business model.
Redefining Concentration Risk
Investors often gauge concentration risk in a fund, index, or ETF by simply counting the number of securities held. This approach can disadvantage managers of concentrated portfolios, as fewer holdings are frequently equated with limited diversification.
Companies are rarely monolithic. They often comprise multiple product lines that span distinct customer segments and business risks. As a result, true diversification may be far greater than the headline number of holdings suggests. A portfolio with just 20 securities could offer exposure to 50 or more distinct product lines.
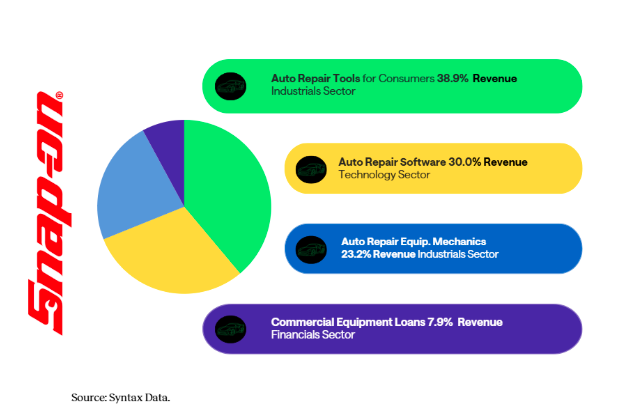
Take Snap-On Inc., for example. While it may appear to be a single-product company serving auto mechanics, Exhibit 2 reveals a more nuanced and diversified business model.
Exhibit 2: Snap-On Product Line & Sector Exposure Profile
The graphic highlights that Snap-On has four product lines across three different sectors (industrials, technology, and finance). The business for which it is most well-known — auto repair equipment for mechanics — is actually its third-largest product line (23.2% of revenue). Peeling back the onion highlights that Snap-On sells to both consumers and businesses, and provides exposure to themes like consumer spending and software that most investors are unaware of.
Providing Insights Into What Investors Own
Asset managers publish fact sheets and produce presentations that show sector exposures. The challenge is these sector exposures are too generic to draw meaningful conclusions about how the portfolio is invested. Two portfolios with similar sector allocations may have substantially different risks based on how they allocate to subsectors and industries. This presents a risk to managers, as advisors, consultants, and investors may draw conclusions from the data that do not align with the manager’s messaging about the product. Using new and more detailed data sources represents an opportunity for managers to rewrite their story.
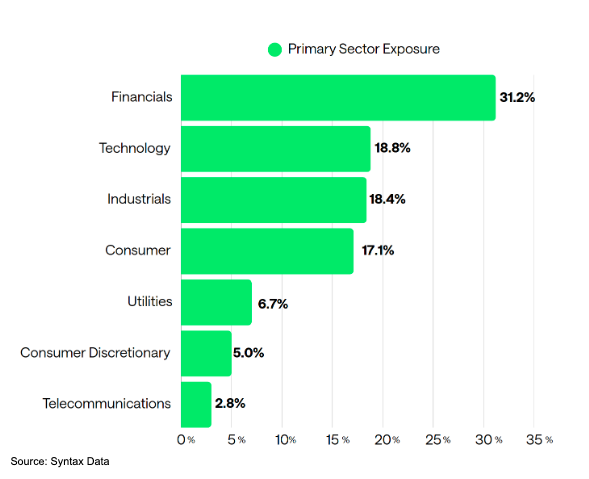
Exhibit 3 shows the sector allocations for a sample midcap portfolio. The large allocation to financials and overall sector holdings could lead an investor to surmise this is a value-oriented portfolio with meaningful allocations to banks and insurers.
Exhibit 3: Sample Midcap Manager Sector Weights
Yet when we look beyond headline sector exposure, a more nuanced picture emerges.
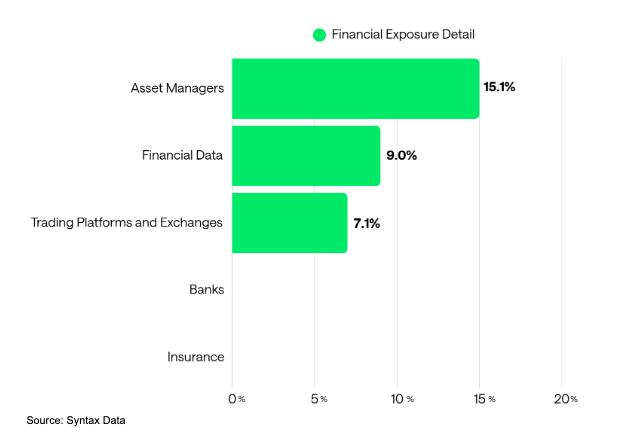
Exhibit 4 illustrates how drilling down from broad sector classifications to subsector level detail reveals a more compelling narrative around the manager’s financials holdings.
Exhibit 4: Financials Exposure Detail
Despite what Exhibit 3’s primary sector breakdown might suggest, this portfolio has no exposure to banks or insurers. Instead, its financials allocation is concentrated in companies that specialize in data, trading, and service-driven models. Below is an example of language a manager could use to help control the product’s narrative and shape investor perception.
Financials at 31% represent the largest weight in the portfolio. This sector is often associated with banks and insurers, which typically have relatively high leverage ratios and are usually interest rate sensitive. However, our holdings in this sector are focused on companies involved in asset management, data and information services, and transaction processing. These information- and data-driven firms are attractive based on their recurring revenue streams, higher margins, attractive growth rates, and reduced reliance on leverage to generate returns.
Incorporating New Dimensions
Moving beyond the standard sector evaluation framework and applying lenses that can provide unique insights into market exposures creates new dimensions altogether. For example, advances in classification have supported the creation of lenses aligned with targeted thematic exposures such as cloud computing, real assets, cryptocurrency, and blockchain. This is particularly helpful for seeing themes that cut across sectors and can shine a new light on a portfolio.
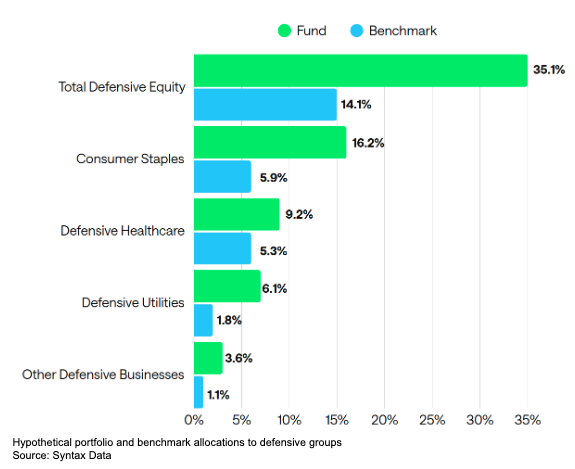
For example, if a manager’s product demonstrates strong downside protection, profiling the holdings through a customized defensive equity lens amplifies an important trait. Exhibit 5 shows the manager’s portfolio has more than twice the allocation to defensive equity than the benchmark. Importantly, lenses can be customized to a manager’s specifications.
Exhibit 5: Defensive Equity Lens Holdings Relative to Benchmark
Conclusion
Using new data sources enables managers to elevate the quality and precision of product profiles, fact sheets, research reports, and pitchbooks. By leveraging product line detail, concentrated portfolios can reveal hidden layers of diversification. Similarly, moving beyond broad sector classifications to subsector or industry-level detail can uncover richer, more compelling stories to share with investors. The use of customized lenses may capture the strategic nuances in how a manager constructs a portfolio.
As Morgan Housel notes in “Same as Ever,” “Great ideas explained poorly can go nowhere, while old or wrong ideas told compellingly can ignite a revolution … a good story is always more powerful and persuasive than ice-cold statistics.”
In today’s ultra-competitive investment landscape, the best story often wins. By harnessing alternative data and presenting insights creatively, managers can shape the narrative around their products and stand out in a crowded market.
Paul Kenney is SVP, Client Solutions at Syntax Data, a financial data and technology company. Syntax Data empowers investment managers, wealth advisors, and financial institutions with precise, transparent data solutions that optimize index development, portfolio customization, and investment analysis to drive better investment outcomes.
A message from Advisor Perspectives and VettaFi: Discover something new! Click here to register for our upcoming webcasts.
Read more articles by Paul Kenney
 Advisor Perspectives welcomes guest contributions. The views presented here do not necessarily represent those of Advisor Perspectives.