Advisor Perspectives welcomes guest contributions. The views presented here do not necessarily represent those of Advisor Perspectives.
For nearly four years, economists have been predicting that consumers would fail to sustain the economy. To their point, sustained high inflation, the fastest Fed tightening cycle in decades, and more recently, surging gasoline prices and interest rates should be taking a toll on consumer spending.
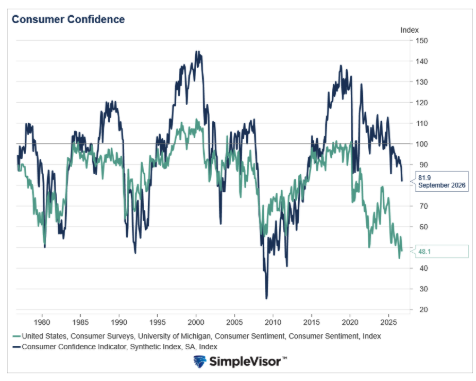
In some respects, those and other factors are weighing on consumers’ minds. The University of Michigan Consumer Sentiment gauge sits at 50-year lows, and the Conference Board Consumer Confidence Index, which may be considered less politically biased, is down to 2014 levels.
Yet despite many reasons for consumers to retrench, real personal consumption expenditures (PCE) grew 2.6% through September. The bottom line: Consumers keep worrying but keep spending.
To better understand this resilience, RIA Advisors built a Consumer Health Index. The index combines income, labor, credit, spending, and price data that should explain how much consumers can afford to spend. We then compared our index to PCE, or what consumers have actually spent. The gaps between the two tell an important story about where spending power is coming from and how durable it may be.
Building Our Consumer Health Index
Our index uses 19 monthly and quarterly data series going back to 2007, drawn from the BEA, BLS, Census Bureau, Federal Reserve, and EIA. The inputs fall into four broad groups:
- Income and labor: real disposable income, real income excluding government transfers, real wages, payrolls, unemployment, and jobless claims
- Credit and balance sheets: consumer credit growth, credit card delinquencies, the household debt service ratio, and bank lending
- Spending momentum: real retail sales, with and without autos and gasoline
- Cost pressures: gasoline prices, used car prices, and CPI
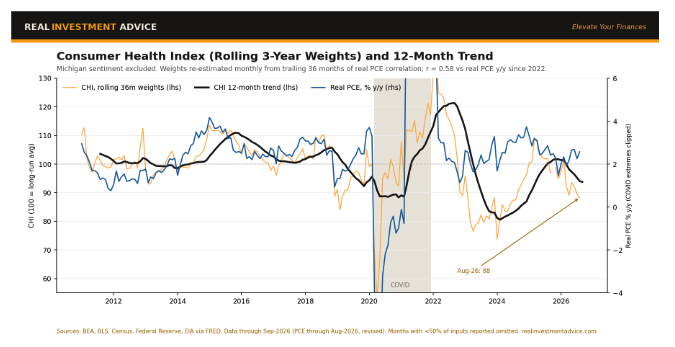
The components are re-weighted monthly based on how closely they tracked real PCE growth over the prior three years. Doing so allows the index weightings to adapt as spending drivers change. We excluded sentiment surveys from our index as they have had essentially no correlation with actual spending for the last 10 years.
Since 2022, our index has had a statistically significant correlation of 0.58 with real PCE growth, as shown below.
The current widening gap between our index and PCE is somewhat unusual, except for the prolonged gap from 2023 to 2024.
The Gaps: 2023–2024 & Today
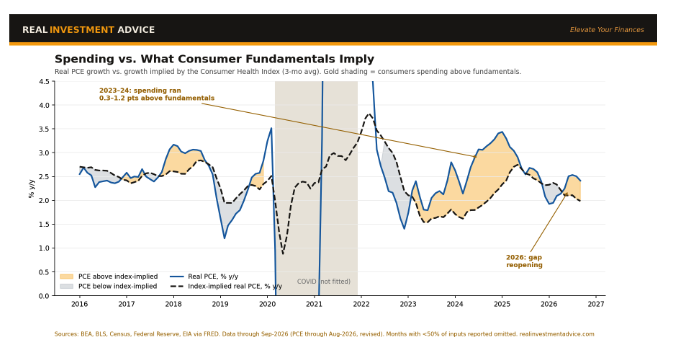
To better highlight the emerging gap and the 2023–2024 gap, the graph below translates the index into the real PCE growth rate it implies. The shaded areas show when consumers spent more (orange) or less (gray) than the index, and thus what the economic data suggested.
Based on our model, consumers are once again spending more than their incomes, jobs, and costs would predict. The question is, what is filling the gap?
What Explains Consumer Resilience
Our index captures the typical household’s income stream. However, several sources of spending power fall outside of it.
A Declining Savings Rate
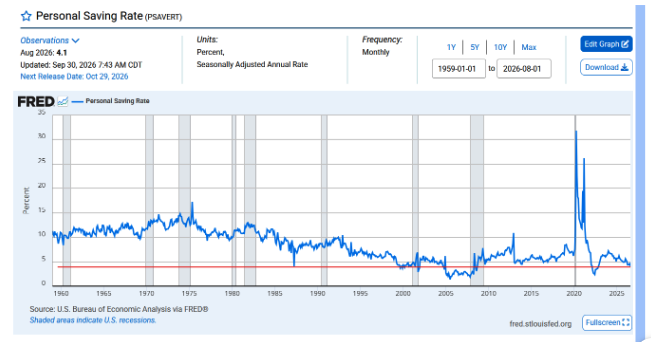
The personal savings rate has fallen from 7.2% in January 2024 to 4.1% today. With the exception of a few months in 2022, the savings rate has not been at or below 4% since 2005–2008. When households save less, spending can outpace income.
Wealth Concentration
Household net worth rose to about $186 trillion in the second quarter of 2026, from roughly $108 trillion at the end of 2019, per the Fed. In 2025, Moody’s Analytics estimated the top 10% of earners accounted for nearly half of all spending, representing the highest share since its data began in 1989.
Wealthier households tend to base consumer decisions more on asset prices and less on factors like paychecks or gas prices. Some economists question the precision of the Moody’s estimate, but regardless, the wealth effect and widening wealth gap strongly influence aggregate consumption patterns.
As an aside, in "The Wealth Effect Is Not Always Virtuous," we estimated that “a $1 increase in incomes should lead to a $2.63 increase in GDP,” while “a $1 gain in equity wealth should lead to a $1.054 increase in GDP.” Asset-driven spending is real, but it is much less powerful than income-driven spending.
Transfers & Retirees
As of August, annual personal transfer receipts, largely Social Security, Medicare, and Medicaid, totaled $5.2 trillion, up almost 70% since 2019. Retiree spending is largely insulated from labor market conditions.
Population Growth
Strong immigration growth from 2022 to 2024 boosted aggregate spending. Our index measures rates, such as wage and payroll growth, not the number of consumers.
Credit
Revolving credit grew as much as 15% year over year from 2022 to 2023, helping fund spending during the inflation surge. While buy now, pay later loans are not captured in the data, revolving credit is only expanding at 3% to 4% today, so unlike 2023 and 2024, consumers are not excessively taking on credit to fund spending.
What Could Change
A critical factor from the spending sources is that the savings rate has little room to decline further. As we noted in "Low Savings Boosts Spending Today But At A Cost Tomorrow," historically, low savings rates tend to revert to higher levels.
Now that households can no longer draw down their savings, spending must track income more closely. With real income excluding transfers growing at less than 1%, any increase in the savings rate should reduce spending.
Several other catalysts could close the gap:
- A stock market decline: The top 10% of earners, who now drive nearly half of spending, would likely pull back if their wealth were to shrink.
- A weaker labor market: Rising layoffs would hit the broad consumer base our index tracks and also raise concerns among those with jobs, likely pushing the savings rate higher.
- Persistently high gasoline prices: At over $4.00 per gallon, gasoline continues to erode real incomes and weigh on sentiment.
- Credit stress: Tighter lending standards, rising delinquencies, and higher interest rates will limit borrowing.
It's just as important to consider that the gap could also close from below. If gasoline prices retreat, interest rates fall, and real incomes recover, our index would rise to meet spending rather than spending falling to meet the index.
Ramifications for Both Scenarios
If spending converges down to the index:
- Real PCE growth would slow toward 1.0% to 2.0%, based on the index’s recent readings. With consumption at roughly two-thirds of GDP, economic growth would be meaningfully affected.
- Consumer discretionary companies, particularly those reliant on high-income households, would face downside risk.
- The Fed would have room to stop hiking rates and potentially consider cutting them.
- The savings rate would rise. While rebuilding household cushions is healthy, it would come at the expense of near-term growth.
If the index rises to meet spending:
- The economy would sidestep a consumer slowdown and extend the expansion.
- However, more demand could keep inflation elevated, possibly leading to more rate hikes and higher yields, which could in turn hurt the economy.
- Asset prices would remain a critical support, leaving the economy increasingly dependent on the wealthiest households and the stock market.
Summary
The consumer is more resilient than in past cycles, but not because the typical household is financially healthier. Resilience has come from a falling savings rate, record wealth concentrated among high earners, growing transfer income, and population gains. Our Consumer Health Index shows spending running ahead of fundamentals, just as it did in 2023–2024.
The difference today is that the savings buffer that existed then is largely exhausted. Consumer resilience increasingly rests on the stock market and a stable labor market. Investors should closely follow the savings rate, jobs data, interest rates, and gasoline prices, as they will likely determine whether spending slows toward the index or the index recovers toward spending.
Read more by Michael Lebowitz:
- From TINA To TIGA: Diversification Pays Again
- Japan Disproved the “Debt Causes Inflation” Narrative
- Has the Bond Market Already Done the Fed's Job?
Michael Lebowitz is a portfolio manager with RIA Advisors and author for Real Investment Advice. For more information, contact him at [email protected] or 301.466.1204.
Join RIA Advisors and elevate your career within a deeply experienced team focused on innovation. Our collaborative environment is built on a foundation of advanced technology and effective investment models, designed to enhance your ability to serve clients and grow your practice. Benefit from a supportive culture that encourages professional development and fosters a forward-thinking approach. By joining our team, you’ll be part of a group dedicated to excellence and continuous improvement, empowering you to focus on building meaningful client relationships and pursuing your business ambitions. Discover the advantages of working with our accomplished advisory team by starting your conversation today.
A message from Advisor Perspectives and VettaFi: Discover something new! Click here to register for our upcoming webcasts.
More ETF Topics >
 Advisor Perspectives welcomes guest contributions. The views presented here do not necessarily represent those of Advisor Perspectives.