Advisor Perspectives welcomes guest contributions. The views presented here do not necessarily represent those of Advisor Perspectives.
Key Takeaways
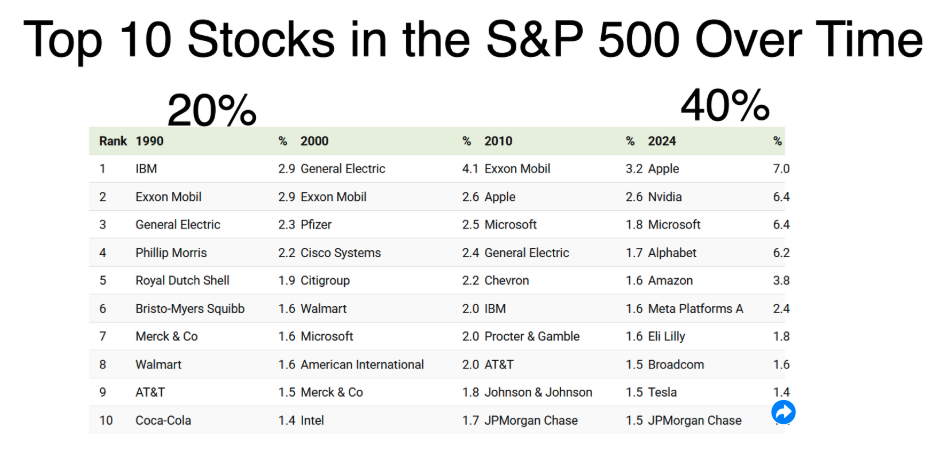
- The S&P 500 is now highly concentrated, with the top 10 stocks comprising 40% of its capitalization versus 20% in 1990.
- None of the top 10 companies from 1990 remain in today's top 10, highlighting shifts in market leadership.
- Current S&P 500 leadership is heavily exposed to AI, raising concerns about escalating investments and potential diminishing returns.
- Investors should consider diversifying beyond the S&P 500’s top 10, as high valuations have historically preceded market corrections.
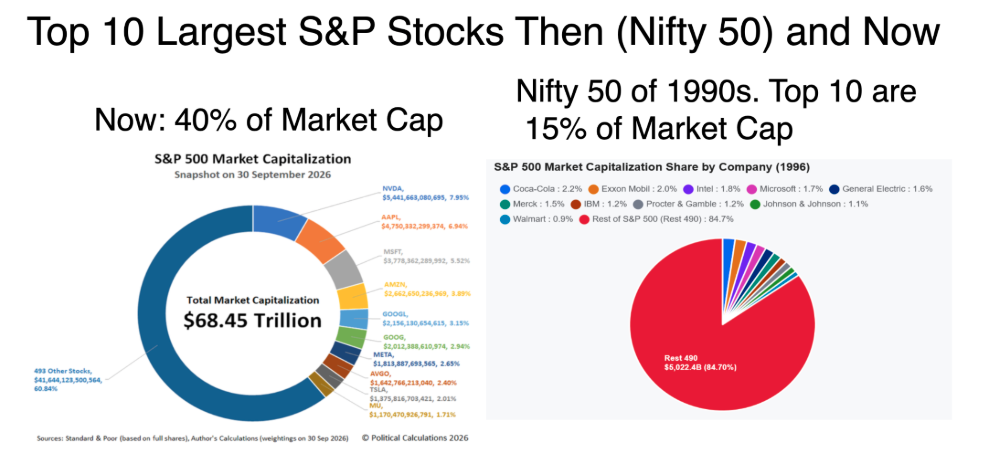
Remember the Nifty 50 of the 1990s, when the largest companies in the S&P 500 were too big to fail? Well, the S&P did fail, and so did those companies. Today, the top 10 make up 40% of the S&P’s capitalization; back then they were only 20%. The S&P has become twice as top-heavy.
Source: Visual Capitalist
It’s also important to note that none of the top 10 companies in 1990 is in the current top 10. Market leadership is 100% different.
Here is a graphical comparison:
What Does it Mean?
S&P 500 investors have doubled their bets on the top 10 stocks, so their performance is twice as dependent on those 10 stocks. Is that a good bet? Who knows, but it is a large bet. Time will tell.
Investors in S&P 500 index funds should consider diversifying beyond those stocks, especially the top 10. The equal-weighted version is gaining popularity as investors look to hedge their bets.
Too Big To Fail?
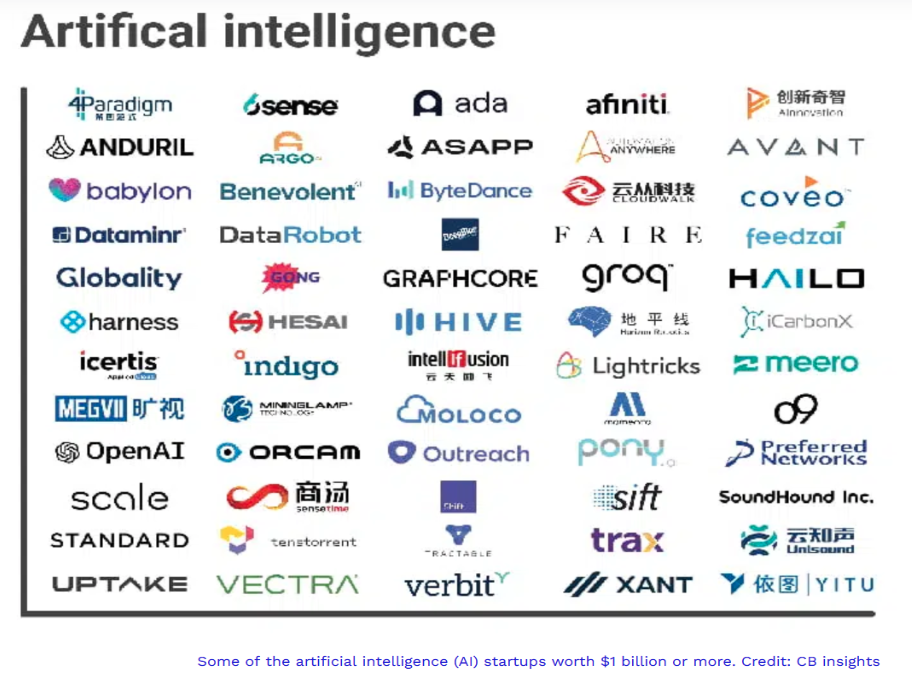
A common thread runs through the current top 10 stocks: They are heavily invested in artificial intelligence. Some observe that these investments must escalate, that they will eventually face diminishing returns, and that only a few will survive. They could go the way of the dot-com bubble. One thing is for sure: The competition is huge, as shown in the chart below.
Cautions
Concentration in AI stocks is making the overall market very expensive, and AI spending is reaching epic proportions.
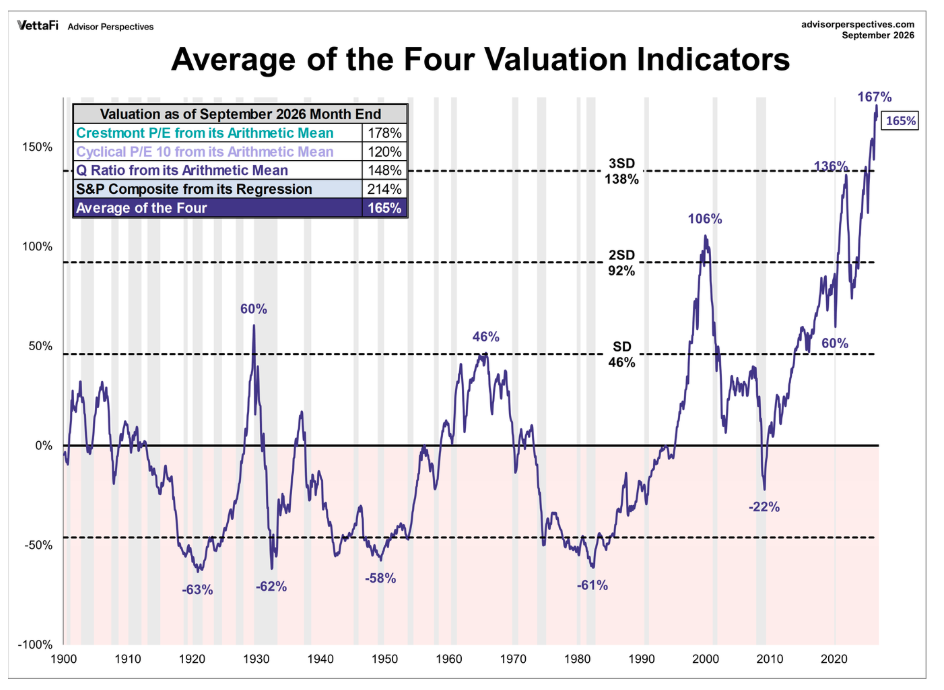
Market valuation indicators currently average 167%, more than three standard deviations above the mean. In the past, markets have crashed when valuation indicators were high, and they’re currently at their highest levels ever.
We are all concerned about the U.S. government spending level of $7.5 trillion versus tax revenue of $5.5 trillion ($2 trillion net). Meanwhile, AI companies are spending $2.5 trillion versus $1 trillion in revenue. For every dollar of taxes collected, the U.S. government spends $1.36. For every dollar of revenue, AI companies spend $2.50 — almost twice as much as the government. In both cases, the level of spending is not sustainable.
Conclusion
Is it different this time? Yes, and market dominance has changed significantly. Has this happened before? Yes, and the dot-com bubble eventually burst.
More articles by Ron Surz:
Ron Surz is president of Target Date Solutions, developer of the patented Safe Landing Glide Path and Soteria personalized target date accounts. He is also co-host of the Baby Boomer Investing Show. Surz’s passion is helping his fellow baby boomers at this critical time in their lives when they are relying on their lifetime savings to support a retirement with dignity, so he wrote a book, “Baby Boomer Investing in the Perilous 2020s,” and he provides a financial educational curriculum.
For anyone who relies on TDFs — or advises those who do — Surz’s new book is a must-read guide to understanding the risks, solutions, and future of a secure retirement.
A message from Advisor Perspectives and VettaFi: Discover something new! Click here to register for our upcoming webcasts.
Read more articles by Ron Surz
 Advisor Perspectives welcomes guest contributions. The views presented here do not necessarily represent those of Advisor Perspectives.