The Siren Song of Growth: Why Investors Willfully Set Sail for the Rocks
Kailash’s Key Concepts:
Tapping into the Profit Potential for Growth Stocks
Beguiled by Mephistopheles’ Smile: the Crux of It All
The Myth of Low PEG SAGE Prunes the Left Tail
Macro Considerations & the Value of Playing Defense
SAGE Stock Characteristics: Some of the Secret Sauce
SAGE: March Buy List for Model Portfolio
Sample SAGE Model Portfolio
Introduction:
Our Core Small & Mid-Cap (Core SMID) model has continued to put up solid results over the last 12 months despite significant name concentration and low turnover in an environment characterized by high levels of market volatility and correlation. While the model has a number of mechanisms that help to systematically exploit large spreads between “growth” and “value” stocks, we admit this has been a year of living cheaply. The Core SMID model’s predilection for value shares at the expense of more traditional growth names has not been lost on a subset of our customers, and there has been some consternation at our relatively defensive posture.
In discussions with investors we struggled to pin down precisely what constitutes a growth company. The striking range of answers has been enlightening if only to reveal the intellectual diversity that can inhabit the predefined style boxes created by consultants. While the more esoteric descriptions often engender entertaining discussion, we have found that they typically prove to be unreliable constructs
for those seeking to build and test the efficacy of an investment process. After examining a range of concepts, we settled on the use of long-term expected earnings growth as a defining proxy for a growth stock. Skeptics should note that in all four major methodologies tested by us (Price-to-Book, Price-to-Sales, Two-Year EPS Growth, Five-Year EPS Growth), the variations in outcome were minimal (+/-3%).
Be guiled by Mephistopheles’ 1 Smile: the Crux of It All
High growth investing is an art that arguably rewards analytical prowess more richly than many other investment disciplines. Investors need to be mindful that the cost of errors in the growth world, no matter if it is in the investor’s control or not, comes more often and with dire consequences. Generically, we believe this foots with intuition as the world of high growth is frequently accompanied by a combustible and contravening mix of higher payoffs, higher expectations and higher risks.
Since Fig. 1 below lies at the very heart of our paper and at the core of how we hope to increase the success rates for growth investors, allow us a moment of explanation. The horizontal axis is broken up into the deciles of 12-month relative returns, ranked from the worst decile to the best. Historically, the stocks in our SMID universe that landed in decile one, on average, underperformed the Russell 2000 Growth (R2000G) by 63% while stocks that landed in decile 10 went on to beat the R2000G by 100% on average. Fig. 1 takes the fastest growing stocks in our SMID universe and then looks at what percent of these stocks end up in each decile of 12-month relative returns.
What we see here is that stocks with the highest expected growth have very low central tendencies and very fat tails that, when charted, create a “smile.” This smile effect means that for growth investors playing in this category, there is a great potential to achieve significant excess returns when picking stocks from the group, but an even greater potential for failure. We’ve dubbed this chart “Mephistopheles’ Smile” because the large number of stocks in the top two deciles is dwarfed by the even greater numbers that appear in the bottom two. The negative asymmetry of outcomes here is further exacerbated by the geometric nature of returns; an alluring but crooked “smile” if ever there was one.
Please see analyst’s certification and important disclosures in Appendix A of this report.
Fig. 1: Mephistopheles’ Smile: Distribution of 12-Month Relative Returns for High-Growth Stocks
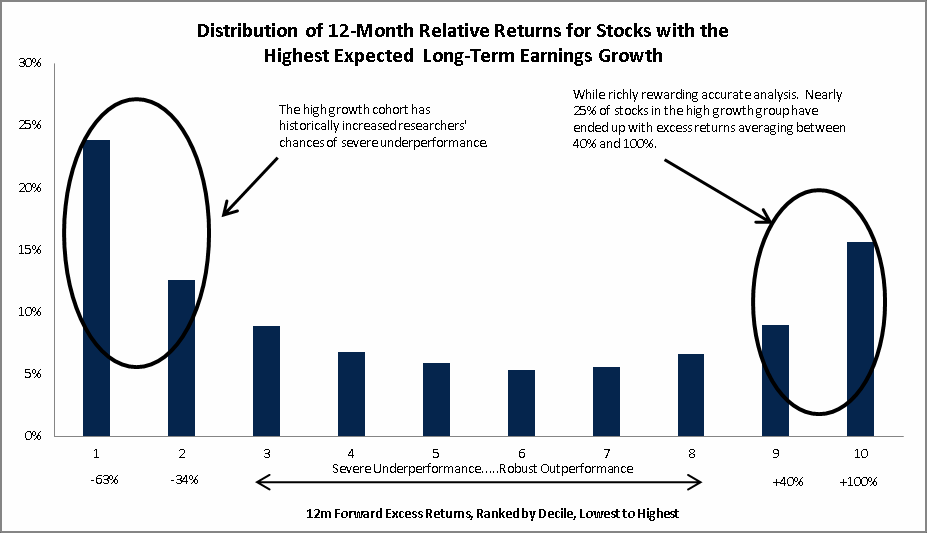
Note: Data from 4/30/1989 – 12/31/2011 KER SMID Universe
Source: Knight Equity Research, Russell, Compustat
Context helps inform as to just how precarious a world Mephistopheles has created for growth investors. In Fig. 2 we have overlaid the distribution of future outcomes for both the highest and lowest growth stocks. You can see that the low growth stocks (light blue bars) create a virtual “frown” in their distribution. While historically investors had about a 5% chance of doubling their money in this category, they also only had a 5% chance of losing two-thirds of their money (on a relative basis). Stocks with low expected growth rates seem to offer managers lower payoffs for accurate foresight but also greatly reduce the risk of catastrophe while increasing the chance of making modest and consistent returns.
Fig. 2: Distribution of 12-Month Relative Returns for Highest & Lowest Growth Stocks
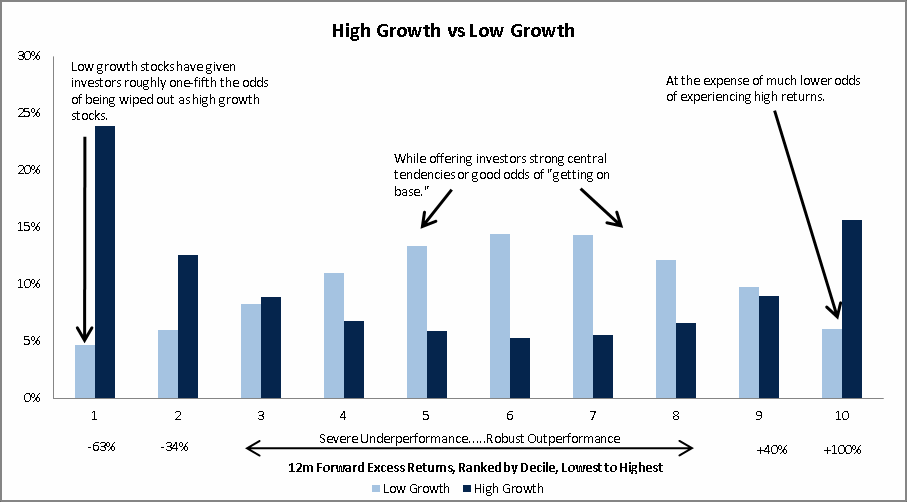
Note: Data from 4/30/1989 – 12/31/2011 KER SMID Universe
Source: Knight Equity Research, Russell, Compustat
The Myth of Low PE to Growth in SMID
We believe a significant cohort of growth investors recognize the volatile characteristics of pure growth investing and have moved into a value/growth hybrid method or “growth at a reasonable price” (GARP). We applaud this concept and think robust risk-adjusted returns can be achieved by properly tethering growth and value together. Unfortunately, some of the client literature we’ve read seems to focus on the concept of buying high growth stocks with low PE to Growth (PEG) ratios. Some investors seem to believe that buying low PEG shares in the high growth universe will allow them to benefit from both growth and multiple expansion. We find this worrisome as our analysis, shown in Fig. 3 below, demonstrates that PEG used as a standalone tool lacks efficacy. In our analysis, the distribution of average annual arithmetic returns shows no defining tendency with deciles one and two performing much the same as seven and n ine, and deciles three and four roughly matching the performance of those seen in deciles eight and 10.
Fig. 3: Simple PEG Strategies Leave Much to Be Desired
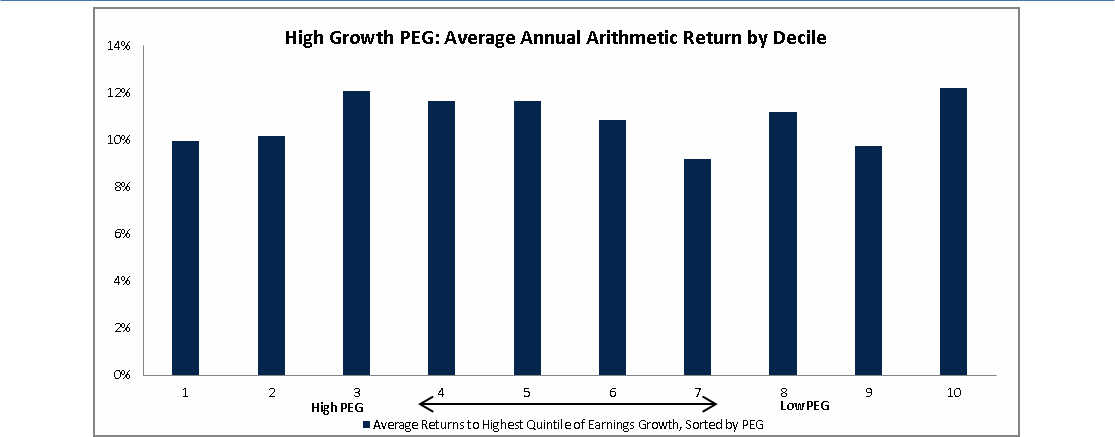
Note: Data from 4/30/1989 – 12/31/2011 KER SMID Universe
Source: Knight Equity Research, Russell, Compustat
Similarly, looking at Fig. 4 we find that adding PEG to a high growth strategy does little to increase 12-month batting averages. Across the distribution, we detect no statistically significant pattern. Contrary to what many users of PEG might expect, Fig. 5 demonstrates that adjusting PE ratios for growth rates appears to do nothing to diminish the maximum excess drawdowns across deciles. This tells us that attempts to solve the complex issues faced by high growth investors with simple univariate solutions may end poorly across any reasonable time period.
Fig. 4: PEG Has Done Nothing to Help Batting Averages Fig. 5: Excess Drawdowns Have Not Favored Low PEG
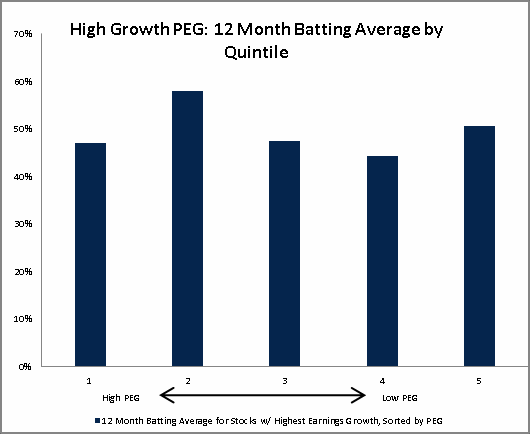
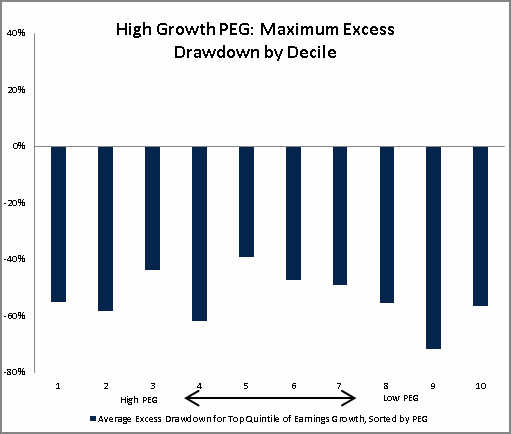
Note for both figures Data from 4/30/1989 – 12/31/2011 KER SMID Universe
Source: Knight Equity Research, Russell, Compustat
SAGE: Pruning the Left Tail
In an effort to better fortify the intersection of value and growth, we designed a model dedicated to sourcing growth stocks from the Core SMID strategy. Dubbed the Systematic Analysis of Growth in Earnings Model (SAGE), Fig. 6 shows our basic strategy characteristics. Using the same portfolio method as our Core model, we were pleasantly surprised by the SAGE model’s ability to reduce the average portfolio size from the typical ~100 names a year that we rely on in Core to just over 40 for SAGE while still maintaining over 900bps of excess annual returns and an information ratio north of .90. For fundamental users this should translate into a highly concentrated set of four new ideas a month that will be sourced from the world of high growth. If you are not familiar with our glacial turnover and fundamentally compatible name selection process, please contact your Knight Representative.
Fig. 6: SAGE Performance Based on Historical Composite Portfolio Data
|
Portfolio Characteristics |
|||||
|
Annual Excess Return |
Information Ratio |
Average New Ideas Per Month |
Average # of Names in a Portfolio |
Holding Period |
SAGE Batting Average vs R2000G |
|
9.5% |
0.9 |
4 |
41 |
1 Year |
50.7% |
|
Price to Book |
Price to Sales |
Price to Earnings |
Debt to Price |
ROE |
Shareholder Yield |
|
2.4 |
1.0 |
25.2 |
32.6% |
15.8% |
2.8% |
Note: Data from 4/30/1989 – 12/31/2011 KER SMID Universe
Source: Knight Equity Research, Russell, Compustat
Fig. 7 shows us the comparative annual returns from the SAGE strategy vs. the R2000G index. You can see that while a few modest shortfalls have occurred in some years, the SAGE process has produced excess returns fairly consistently. The post-2006 performance in particular stands out as an example of the model’s stock selection in the face of whip-saw volatility. In speaking with friends who focus exclusively on the growth universe, the white-knuckled nature of “risk-on”/ “risk-off” switching is a common area of anxiety. Looking at the model’s historic outperformance during the tremendous draw-down of 2008 and subsequent ability to thrive in the rallies of 2009 and 2010 gives us some confidence that we have done a respectable job balancing the need for both outperformance on the upside and capital preservation, while still hewing to the growth mandate.
Fig. 7: The SAGE Process Provides Potential for Relative Returns in Multiple Market Environments
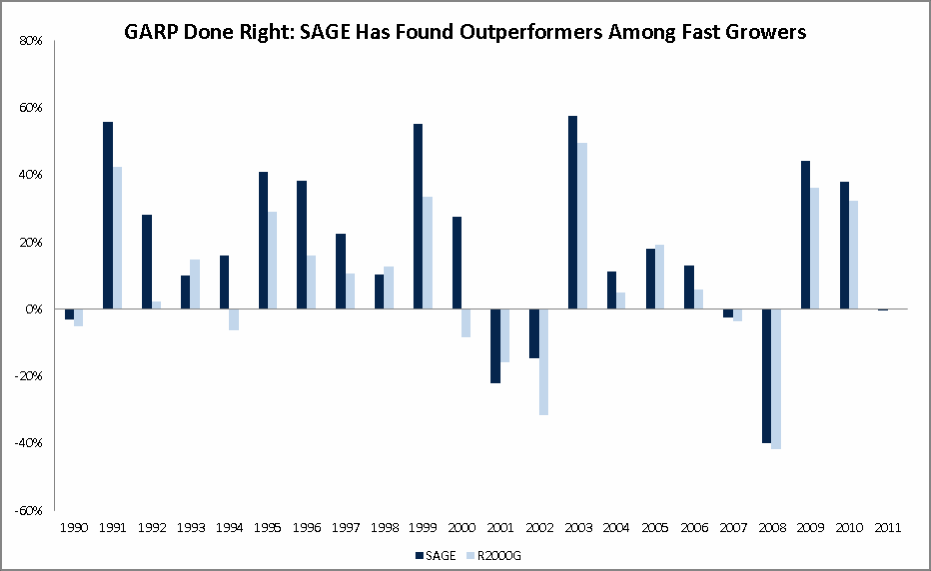
Note: Data from 4/30/1989 – 12/31/2011 KER SMID Universe
Source: Knight Equity Research, Russell, Compustat
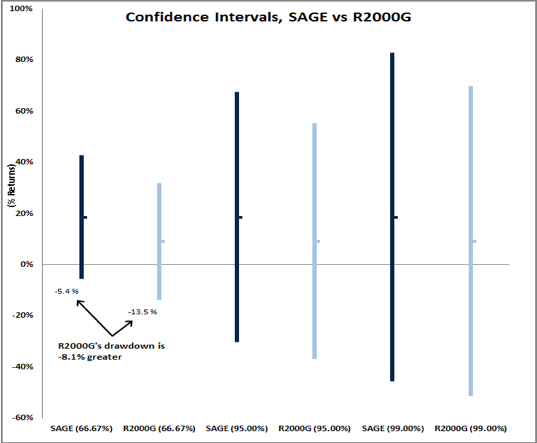
Figure 8 below illustrates how risk reduction lies at the heart of our SAGE stock selection process. This graph shows the distribution of outcomes for both the high growth universe and the SAGE-optimized growth universe. Our process allows one to shop from stocks
with the fastest earnings growth in the R2000G while cutting the odds of experiencing the most severe drawdowns from ~24% to ~13%. This sharp reduction in left tail outcomes benefitted from a simultaneous increase in the odds of finding outperformers at every decile with excess returns (decile 6 and above). We believe working with our SAGE list should help significantly reduce the time you spend working on stocks that turn out to be left-tail losers, enhance your chances of finding right-tail winners and, as a result, give you that much more time to get to know the companies and managements that could help your portfolio outperform.
Fig. 8: Redeeming Faust: SAGE Should Reduce Left Tail Risk while Expanding Right Tail Potential
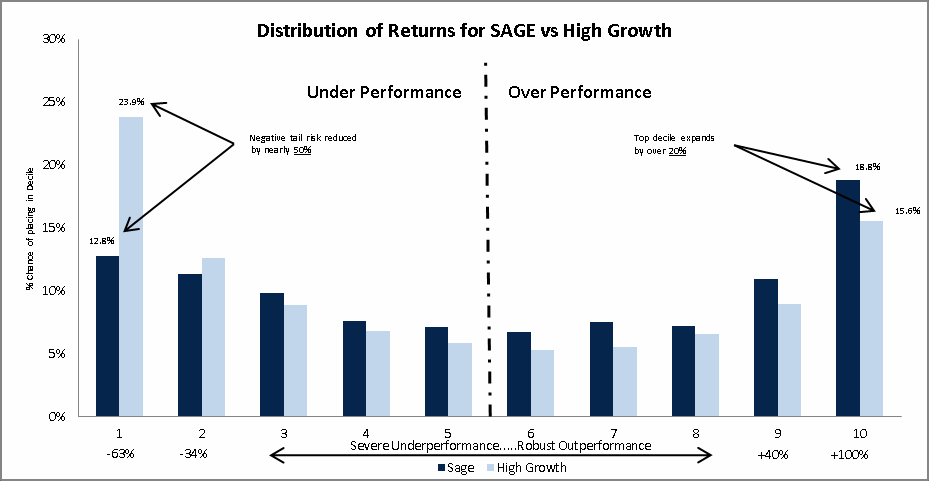
Note: Data from 4/30/1989 – 12/31/2011 KER SMID Universe
Source: Knight Equity Research, Russell, Compustat
You can see, from Figs. 9 and 10, the significant improvements our growth model has historically offered over the R2000G index. Fig.
9 shows the benefits that may accrue to consistent users who work with the process over time. Similarly, one can see, in Fig. 10, the means and distributions at roughly the one, two and three sigma levels and see that historically, in all cases, the model reduced downside variability considerably.
Fig. 9: SAGE Has Had Solid Batting Averages Fig. 10: Means & Tails Improve at Every Sigma
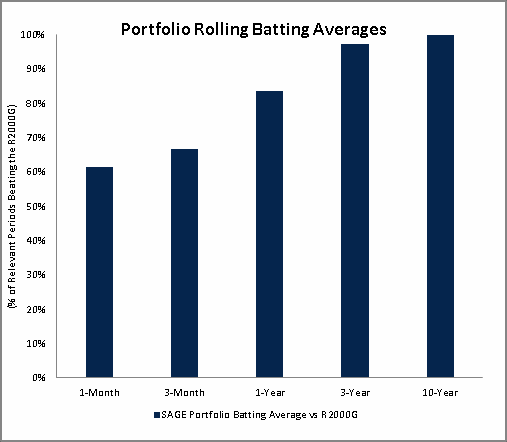
Note for both figures: Data from 4/30/1989 – 12/31/2011 KER SMID Universe
Source for both figures: Knight Equity Research, Russell, Compustat
Macro Considerations & the Value of Playing Defense:
Kailash Concepts makes no apologies for the risk aversion we bring to our SAGE initiative. We understand that our growth stocks will often lack the cachet coveted by some growth investors. Due to the wide disparity of views on what specifically constitutes a growth company, we thought it might be helpful to bring our readers’ attention to two particular pieces of analysis done by Eugene F. Fama and Kenneth R. French2. The authors broke the equity universe down into six primary buckets based on size, growth and value. Fig. 11 below shows the composition of returns in the 1963 to 2006 period.
For most readers the chart may resonate with what we have come to associate with intuition or common sense. Value stocks tend to source a larger proportion of their returns from dividends while growth stocks generally benefit more from capital gains. We think this concept is likely so ingrained in investors and consultants alike that they approach stock selection in the growth and value universes accordingly and without question.
Fig. 11: Post-1963 Data Foots with Intuition: Capital Gains Drive Growth Returns > Value Returns
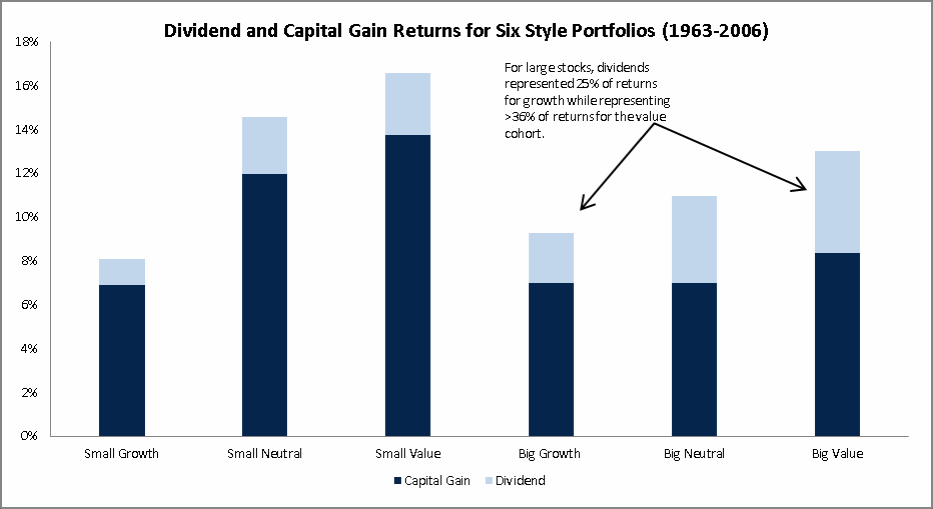
Source: Knight Equity Research, Fama & French “The Anatomy of Value and Growth Stock Returns.”
As you can see from Fig. 12, between 1927-1963, the composition of returns by security type diverged dramatically from where modern intuition might have led us. According to Fama and French’s analysis, dividends actually represented a higher percentage of returns for growth stocks than value stocks in both Big and Small size cohorts. The members of Kailash Concepts make no claim to macroeconomic prowess so we leave the study of governments and their abilities as stewards of public funds to others. That said, we don’t believe market participants need advanced degrees to postulate that the current environment, characterized by its high levels of consumer and sovereign debt, might resemble the 1927-1963 period a bit more than the post-1963 period. In light of this, one must ask “Should growth investors be paying more attention to the return of capital than to just the rate of retained earnings growth?”
Fig. 12: The 1927-1963 Data Points to the Need for a More Open-Minded Approach to Growth Investing
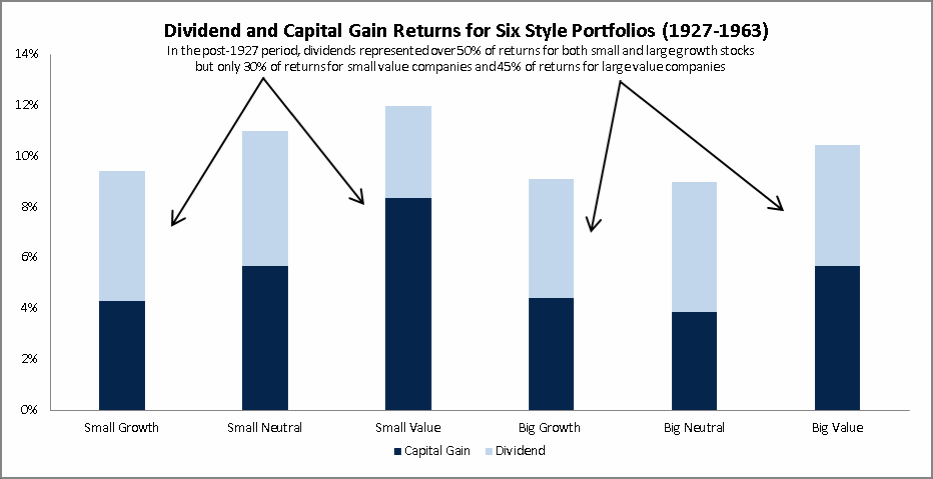
Source: Knight Equity Research, Fama and French “The Anatomy of Value and Growth Stock Returns.”
We believe “Yes” to be the unequivocal answer. Below, we show the sum of both dividend and buyback yields (shareholder yield) for our model portfolio of SAGE growth stocks. The debate around the potential for misallocation of capital via buybacks and the extent to which they are a true proxy for dividends has been both topical and lively over the past year. While everyone is entitled to their opinion, we believe the conclusions drawn by Fama and French are too important to ignore. While the presence of dividends and buy-backs in our growth model has been erratic over time, as can be seen in Fig. 13, current levels are notably higher than the R2000G median. We believe that the current spread in shareholder yield between our SAGE picks and the R2000G could provide investors with potential exposure to the returns available from high growth shares, while offering a bulwark against an uncertain macro backdrop should a 1927-1963 environment prove to be the proper historical precedent.
Fig. 13: SAGE Stocks Currently Have Significant Shareholder Yield (Dividend + Buyback)

Note: Data from 4/30/1989 – 12/31/2011 KER SMID Universe
Source: Knight Equity Research, Russell, Compustat
SAGE Stock Characteristics: Some of the Secret Sauce
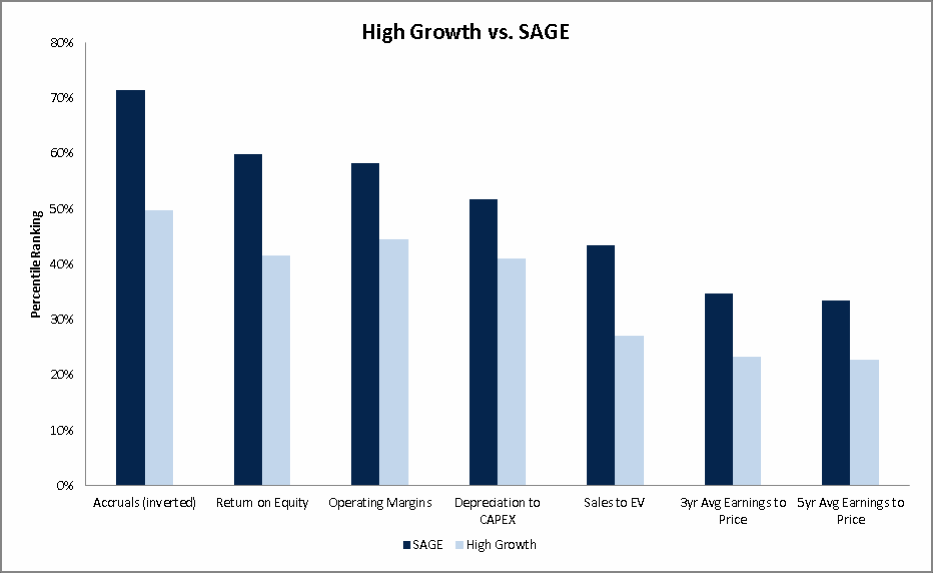
Investors have expressed intermittent frustration at our Core SMID model’s lack of linear behavior. In our experience as fundamental investors, we have not found that simply seeking out a simple combination of highly or lowly ranked factors has contributed to universally better outcomes. Instead, we tend to focus on the interaction of critical variables, the behavior and expectations of market participants and the ability of corporations to intelligently and reliably deploy capital. That said, we understand the need to apprise users of the core areas where our portfolios differentiate themselves from the typical investment product. Fig. 14 below is sourced from our master signal book and demonstrates seven of the most critical variables that tend to abet what we see as our model’s advantage over a typical stock in the high growth universe.
Fig. 14: SAGE Stocks: Important Traits for High Growth Companies
Note: Data from 4/30/1989 – 12/31/2011 KER SMID Universe
Source: Knight Equity Research, Russell, Compustat
Fig. 14 shows the average percentiles for our model portfolio companies compared to the average of all companies in the high growth cohort in the SMID universe. In all cases, higher percentiles imply a more favorable score from our model. On average, we believe the companies that the model recommends tend to have higher levels of cash conversion of earnings, higher profitability, relatively low capital requirements for a growth stock and benefit from lower valuations in areas in which mean reversion may prove helpful to owners. Please note that Fig. 14 represents the graphical output of a large sample observation across 22 years and should not be expected of all SAGE’s individual monthly picks.
The full SMID analytical product, as well as the model’s relative valuation ranking outputs, are available for interested RIAs and family offices. For more information on SAGE, Core SMID or more details on the models valuation metrics please contact: Timothy Straus at: [email protected]
DISCLOSURE STATEMENT: This information and opinions in this report have been prepared by Knight Capital Americas, L.P. and may be distributed by Knight Capital Americas, L.P. or its affiliates (collectively, "Knight"). Any recommendation contained in this report may not be suitable for all investors. Moreover, although the information contained herein has been obtained from sources believed to be reliable, its accuracy and completeness cannot be guaranteed. Knight has no obligation to tell you when opinions or information in the report change.
Valuation Methods and Risks: Research notes and reports include a discussion of valuation methods used, including methods used to determine a price target (if any), and a discussion of the risks to the price target.
This report is issued and approved for distribution in the United States by Knight Capital Americas, L.P., member FINRA, NYSE and SIPC.
This document is a product of Knight Capital Americas, L.P.. The parent company, Knight Capital Group, Inc. ("Knight") is comprised of several trading and related entities under common control. Such entities include Knight Capital Americas, L.P., Knight Capital Europe Limited, Knight Execution & Clearing Services LLC and Knight Capital Asia Limited.
1 Mephistopheles is a character perhaps most famously known from Johann Wolfgang von Goethe’s Faust, A Tragedy who convinces Faust to sell his soul in exchange for knowledge and power. Although the name is most synonymous with Goethe’s Faust, Mephistopheles is referenced in various other literary and popular culture sources and is primarily depicted as a conniving and devious creature that tricks and cons others for his own gains and amusement.
2 Fama, Eugene F. and Kenneth French. “The Anatomy of Value and Growth Stock Returns.” Financial Analyst Journal 63.6 (2007): 44-54.
© 2012 Knight Capital Group, Inc. All rights reserved. No part of this document may be reproduced, distributed, transmitted, displayed, or re-published without the prior written permission of Knight Capital Group, which permission may be sought by contacting Matt Malgari at [email protected]