Dividends and Market Returns:
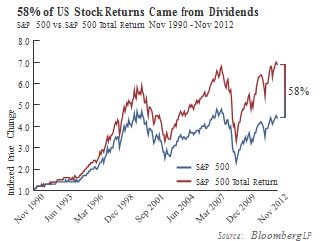
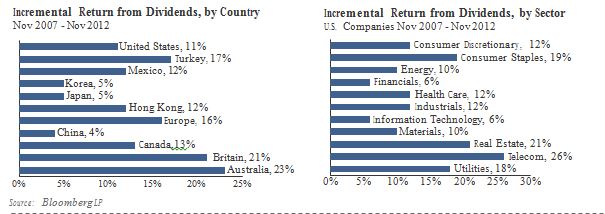
The compounding impacts of dividends have historically been significant in terms of market returns for long-term investors. The importance of these cash flows to investor returns can be seen across countries and industries.
However, over the last four decades the pronounced growth of stock buybacks has dimmed the lights on the importance of dividends. From 1972 to 1998 the dividend payout ratio of publicly listed U.S. companies declined from 22% to 14%. Over this same period, the ratio of share repurchases relative to earnings increased from 3% to 14%.1 As a result, the total cash payout to shareholders rose to 28% of earnings. It is important to note that, prior to 1971, buybacks were relatively rare. Wage and price controls imposed by the Nixon administration placed restrictions on dividend payments and induced a number of firms to consider share repurchases. Further impetus for repurchases came from the issuance of SEC rule 10b-18, which provided guidelines for firms that wished to repurchase shares in the open market.
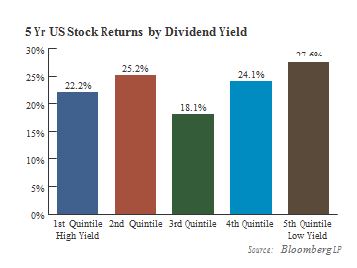
Following the 2008-2009 financial crisis, Federal Reserve Zero Interest Rate Policy (ZIRP) put renewed emphasis on investable assets providing reasonable levels of absolute yield, leading investors to seek out investment strategies and products that focus on yield. Unfortunately, yield alone has not provided investors with superior market returns.
In general, firms with equivalent cash flows but different dividend yields reflect investor perception of the risk to future cash flows. Investors attach higher risk to higher yielding securities by discounting their future cash flows at higher rates. So, there is a relationship between dividend payouts and expected returns (Blume, 1980).
Do dividends matter?
The question of whether dividends matter has been the subject of much research attention over many decades. Academic scholars Franco Modigliani and Merton Miller examined a hypothetical firm that wanted to distribute a fixed amount of cash to its shareholders either by repurchasing shares or by paying a cash dividend, finding that neither option impacted the firm’s investment decisions or operations. Their study demonstrated that, in the absence of personal taxes or transaction costs, the choice between paying a dividend and repurchasing shares is a matter of indifference. However, most corporate managers believe that this proposition ignores market realities.
Given the tax advantages of stock buybacks, why do firms continue to payout so much of after-tax earnings in the form of dividends? The reason: it positively impacts stock returns.
|
• |
Impact of announced dividend increase = 2% |
( Aharonyand Swary, 1980) |
|
• |
Initiation of a quarterly dividend = >2% |
(Michaely,Thaler & Womack, 1995) |
|
• |
Reduction of a dividend = -9.5% |
(Healy and Palepu, 1988) |
![]() Our own observations incline us to believe that dividend increases may impact the market to an even greater degree than these earlier academic works suggest. Dividends are seen as more than temporal increases to investor cash flows and therefore signal to the market positive longer-term expectations for operating cash flows. For example, following dividend increases, equity analysts have tended to increase their earnings forecasts more for low price-to-book firms than for high price-o-book firms, which often pay no dividends (think of the classic growing tech company as an example). In general, dividend increases generated only slight stock price increases for firms viewed as having favorable investment opportunities (i.e, higher P/B firms). Contrasting this, dividend increases resulted in much larger stock price responses for firms believed to have unfavorable investment opportunities. Hence, the payoff differential between stock buybacks and dividends tends to be imperfect.
Our own observations incline us to believe that dividend increases may impact the market to an even greater degree than these earlier academic works suggest. Dividends are seen as more than temporal increases to investor cash flows and therefore signal to the market positive longer-term expectations for operating cash flows. For example, following dividend increases, equity analysts have tended to increase their earnings forecasts more for low price-to-book firms than for high price-o-book firms, which often pay no dividends (think of the classic growing tech company as an example). In general, dividend increases generated only slight stock price increases for firms viewed as having favorable investment opportunities (i.e, higher P/B firms). Contrasting this, dividend increases resulted in much larger stock price responses for firms believed to have unfavorable investment opportunities. Hence, the payoff differential between stock buybacks and dividends tends to be imperfect.
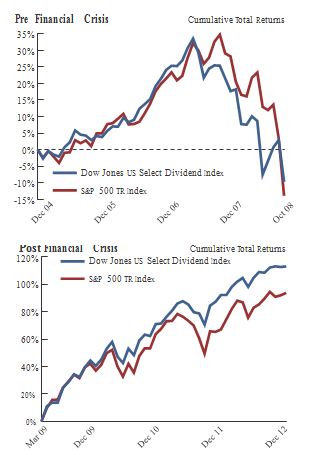
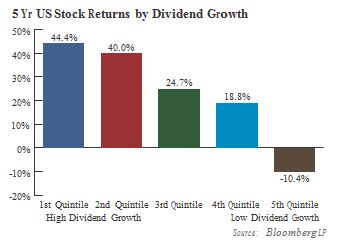
The financial crisis and its aftermath have added layers of uncertainty to the investment puzzle. With investors seeking to mitigate risk, it appears the role of dividend policy has taken heightened importance. Dividend- growing stocks modestly outperformed the broader equity markets in the five years prior to the start of the financial crisis.
Post-financial crisis, dividend growth appears to be increasingly favored by investors.
Indeed, dividend growth has been a much larger determinant of equity returns in this new era of low benchmark rates and higher levels of uncertainty.
Overall, we believe that the combination of yield and growth, combined with strong underlying fundamentals, should provide investors with superior long-term returns relative to the broad equity benchmarks.
Changes in dividend payouts tend to have above average impact on firm value. Financial information that conveys favorable information to the market tends to increase stock prices, even when the decisions are potentially negative for the firm’s future profitability. Dividend increases in particular can diminish intrinsic values, but still generate positive![]() stock price responses because they signal favorable information. As a consequence, dividend growth as a strategy can mitigate investment risk.
stock price responses because they signal favorable information. As a consequence, dividend growth as a strategy can mitigate investment risk.
Footnotes
1 Grullon, Gustavo and Michaely, Roni. Dividends, Share Repurchases, and the SubstitutionHypothesis (April 2000).AFA 2002 Atlanta Meetings.
![]() 2 The Modigliani-Miller Theorem (M&M, 1961) posits dividend irrelevance.
2 The Modigliani-Miller Theorem (M&M, 1961) posits dividend irrelevance.
Important Disclaimers and Disclosures
This report is intended only for the information of the reader, and is not to be used for or considered as an offer or the solicitation of an offer to sellor buy any securities or other financial instruments of any kind, including without limitation, any mutual fund or other product offered, sponsored, created, or managed by Saturna Capital Corporation or its subsidiariesor affiliates (“Saturna”). This report is not intended for distribution to, or use by, any person or entity who is a citizen or resident of, or located in, any locality, state, country, or other jurisdiction in which such distribution, publication, availability, or use would be contrary to law or regulation or which would subject Saturna to any registration or licensing requirement within such jurisdiction.
This document should not be considered as providing investment advice or services, or any service offered by Saturna. Saturna may not have taken any steps to ensure that the securities referred to in this report are suitable for any particular investor. Saturna will not treat recipients as its customers by virtue of their reading or receiving the report.
Nothing in this report constitutes investment, legal, accounting or tax advice or a representation that any investment or strategy is suitable or appropriate to a particular investor’s circumstances or otherwise constitutes a personal recommendation to any investor. Saturna does not offer advice on the tax consequences of any investment.
All material presented in this report, unless specifically indicated otherwise, is under copyright to Saturna. None of the material, nor its content, nor any copy of it, may be altered in any way, transmitted to, copied or distributed to any other party, without the prior express written permission of Saturna. Unless otherwise indicated, all trademarks, service marks and logos used in this report are trademarks or service marks of Saturna.
The information in this report was obtained from sources Saturna believes to be reliable and Saturna believes the information and opinions in the material are accurate and complete as of the date of this material. However, information and opinions contained herein will changeover time and without notice. Saturna has no obligation to update or amend any information or opinions at any time. Saturna makes no representations as to the accuracy or completeness of this material, nor does it have any responsibility to ensure that any other materials,
including any containing materially different information, are brought to the attention of any recipient of this report.
![]() Under no circumstances shall Saturna, its employees, or any affiliate, be responsible for any investment decision by any recipient. This material is distributed on condition that it will not form the sole basis or a sufficient basis for any investment decision by any recipient. Any recipient who is not a market professional or institutional investor should seek the advice of an independent financial adviser prior to taking any investment based on this report or for any necessary explanation of its contents.
Under no circumstances shall Saturna, its employees, or any affiliate, be responsible for any investment decision by any recipient. This material is distributed on condition that it will not form the sole basis or a sufficient basis for any investment decision by any recipient. Any recipient who is not a market professional or institutional investor should seek the advice of an independent financial adviser prior to taking any investment based on this report or for any necessary explanation of its contents.
Saturna does not provide tax, legal or accounting advice. Investors should consult their own tax, legal and accounting advisers before engaging in any transaction. In compliance with IRS requirements, recipients are notified that any discussion of U.S. federal tax issues contained or referred to herein is not intended or written to be used for the purpose of (A) avoiding penalties that may be imposed under the Internal Revenue Code; nor (B) promoting, marketing or recommending to another party any transaction or matter discussed herein.
The Dow Jones Industrial Average is a price-weighted index of 30 of the largest, most widely held U.S. stocks. The Dow Jones U.S. Select Dividend Index is an index of 100 stocks selected by dividend yield, subject to screens for dividend-per-share growth rate, dividend payout ratio, and average daily dollar trading volume. The S&P 500 is an index comprised of 500 widely held common stocks considered to be representative of the U.S. stock market in general. The Russell 1000 Growth Index measuresthe performance of U.S. large cap equities. The Russell 2000 Index is comprised of U.S. small cap stocks and measures the performance of the 2,000 smallest U.S. companies in the Russell 3000 Index. The NASDAQ Composite index measures the performance of more than
5,000 U.S.and non-U.S. companies traded “over the counter” through the National Association of Securities Dealers Automated Quotation system. MSCI EAFE Index, produced by Morgan Stanley Capital International, measures the equity market performance of developed markets in Europe, Australasia, and the Far East. The MSCI Emerging Markets Index, produced by Morgan Stanley Capital International, measures equity market performance in over 20 emerging market countries. Barclay’s Capital U.S. Aggregate Bond Index measures the performance of theU.S. bond market. All indices shown are widely recognized unmanaged indices of common stock prices which reflect no deductions for fees, expenses or taxes. Investors can not invest directly in the indices.
Past performance does not imply or guarantee future performance, and no representation or warranty, express or implied, is made regarding future performance. The price, and value of, and income from, any of the securities or financial instruments mentioned inthis report can fall as well as rise. The value of foreign securities and financial instruments is subject to exchange rate fluctuation that may have a positive or adverse effect on the price or income of such securities or financial instruments. Investors in securities such as ADRs – the values of which are influenced by currency volatility – effectively assume this risk.
© Saturna Capital