Investors keeping socking money into U.S. Equities while outflows from bond mutual funds continue. Read this investor insight by TrimTabs Asset Management to learn more about the recent fund flows and what other activity may be foretelling.
Mutual Fund Investors Continue to Dump Bonds: Bond MFs Redeem $17.5 Billion in July after Losing Record $59.4 Billion in June. Record $37.0 Billion Pours into U.S. Equity MFs and ETFs in July.
Several strategists have express amazement at how technically overextended the U.S. stock market has become. One reason for the overextension is no mystery to those who follow fund flows—investors have been pumping money into U.S. equities at the fastest pace ever.
In July through Wednesday, July 24, U.S. equity mutual funds and exchange-traded funds received $37.0 billion, topping the previous record of $34.6 billion in February 2000. Fund flows tend to be a good contrary indicator when they reach extreme levels, so U.S. equity bulls should not expect huge gains from current levels.
Meanwhile, global equities have been a lot less popular even though the average global equity fund’s 4.9% month-to-date gain nearly matches the average U.S. equity fund’s 5.3% month-to-date gain. Global equity MFs and ETFs have received $10.5 billion this month, which is nowhere close to a record.
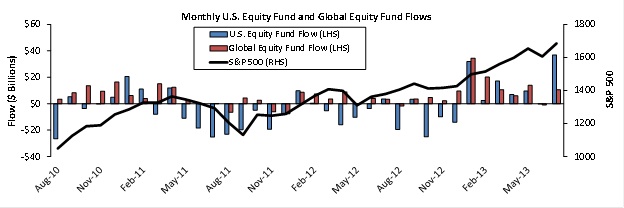 Source: TrimTabs Investment Research
Past performance is not indicative of future results.
Finally, outflows from bond MFs are continuing. On the five trading days ended Wednesday, July 24, bond MFs lost $2.9 billion. For the month, bond MFs have redeemed $17.5 billion. The outflows from bond funds in June and July are a huge change in trend. Before June, bond funds posted inflows for 21 consecutive months. If outflows persist and yields back up further, it would not be good news for the highly leveraged U.S. economy.
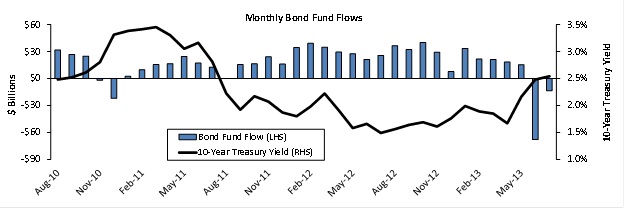
Source: TrimTabs Investment Research
Past performance is not indicative of future results.
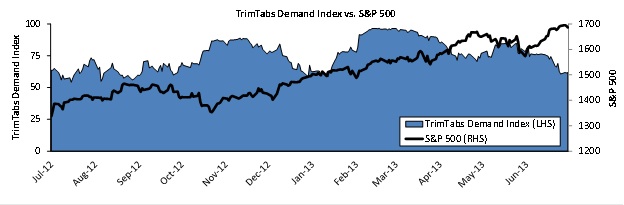
Demand Indicators Do Not Point to Big Gains for Stocks. TrimTabs Demand Index Near Six-Month Low. U.S. Equity ETFs Post Biggest Trailing One-Month Inflow since December 2008.
Our demand-side indicators deteriorated significantly in the past month. While our indicators do not point to a major sell-off, traders should be less aggressive on the long side.
The TrimTabs Demand Index, which uses regression analysis of 21 flow and sentiment variables for intermediate-term market timing, was little changed in the past week. It closed at 61.9 on July 24, which is above the neutrality level of 50 but not far above the six-month low of 60.7 on July 19. Since the index is between 50 and 75, the TrimTabs Demand Index model portfolio is fully bullish (100% long) rather than leveraged bullish (200% long) on U.S. stocks.
Contrarian analysis of ETF flows suggests stock prices are unlikely to rise much over the near term. Massive investment inflows into U.S. equities are bearish from a contrarian perspective. U.S. equity ETFs issued $33.2 billion (3.9% of assets) in the past month, the highest trailing one-month inflow since December 2008.
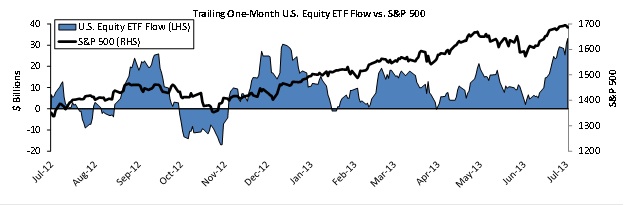 Source: TrimTabs Investment Research
Past performance is not indicative of future results.
The only real bright spot on the demand side—and a key reason we are not expecting a big sell-off anytime soon—is that leveraged ETF investors are still betting against equities. Leveraged long ETFs redeemed 2.7% of assets in the past week, while leveraged short ETFs issued 3.3% of assets.
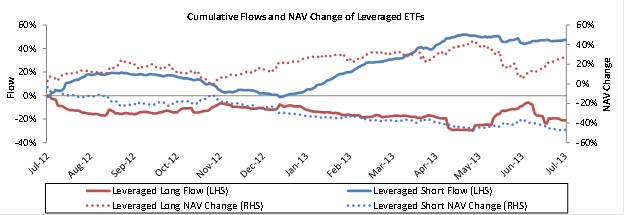 Source: TrimTabs Investment Research
Past performance is not indicative of future results.
U.S. companies remain net buyers of shares, although the level of net buying in recent months has been less strong than it was earlier in the year. In July through Thursday, July 25, announced corporate buying (new cash takeovers + new stock buybacks) of $39.2 billion has been $27.6 billion higher than new offerings of $11.6 billion.
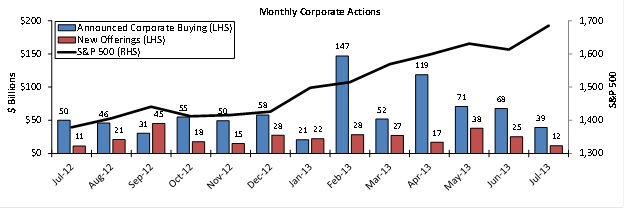
Past performance is not indicative of future results.
This communication is a publication of TrimTabs Asset Management. It should not be regarded as a complete analysis of the subjects discussed. All expressions of opinion reflect the judgment of the authors as of the date of publication and are subject to change. Information presented does not involve the rendering of personalized investment advice. Content should not be construed as an offer to buy or sell, or a solicitation of any offer to buy or sell the securities mentioned herein. Performance results for investment indexes and/or categories, generally do not reflect the deduction of transaction and/or custodial charges or the deduction of an investment-management fee, the incurrence of which would have the effect of decreasing performance returns. All information is based on sources deemed reliable, but no warranty or guarantee is made as to its accuracy or completeness. Past performance may not be indicative of future results. Therefore, no investor should assume that the future performance of any specific investment or investment strategy will be profitable or equal to past performance levels. All investment strategies have the potential for profit or loss. Changes in investment strategies, contributions or withdrawals, and economic conditions, may materially alter the performance of an investor’s portfolio. Different types of investments involve varying degrees of risk, and there can be no assurance that any specific investment or strategy will be suitable or profitable for an investor’s portfolio.
© AdvisorShares