Beginning in late 2011, we began warning that record-high corporate profit margins would start exerting downward pressure on EPS growth. That’s exactly what’s happened. Twelve-month trailing S&P 500 EPS are $89.18, essentially flat from the fourth quarter of 2011. Yet the stock market clearly isn’t focused on this issue, with the S&P 500 up 14% in 2012 and another +14% YTD (price only) in 2013.
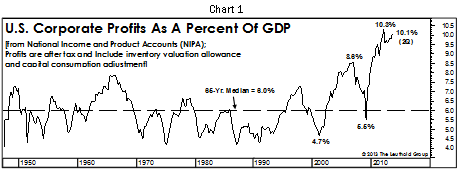
The fourth quarter of 2011 turned out to be the profitability peak (to date) for the current economic expansion, with corporate profits as a percentage of GDP reaching 10.3% -- obliterating the old high of 8.6% set only five years earlier. While we then assumed (and still assume) that quarter would represent the margin peak for this business cycle, the latest quarter’s 10.1% (Chart 1) is close enough that our assumption might be at risk.
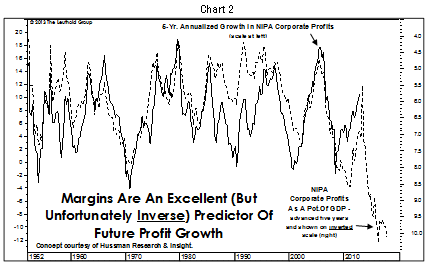
We’ve noted before there’s a strong inverse relationship between the level of profit margins and subsequent 5-yr. profit growth; the correlation between these two series is –0.66. Today’s near-record margins are an impressive corporate feat, but pose an unusually high hurdle for the short– to intermediate-term future. Taken at face value, the relationship suggests today’s margin level will be associated with a 10-12% annualized 5-yr. loss in corporate profits (Chart 2).That isn’t our forecast, but we would certainly agree with the “directional” implications of the chart. Profit growth -- already under pressure for the last year and a half -- will remain challenged largely because profitability today is so high.
The prevailing wisdom is that the past two decades’ margin improvement stems from improved domestic factory efficiency/automation, along with the offshoring of production to low labor-cost locales. This a certainly a good story and there’s no doubt an element of truth behind these claims… but financial statements -- including the National Income and Product Accounts (NIPA -- aren’t transparent enough for us to confirm or deny these arguments. However, the NIPA figures are very clear on two trends that explain almost all of the margin expansion since the mid-1990s.
Remember when the federal government recorded a few quarters of budget surpluses in 1999 and 2000, and fished-eyed economists projected surpluses as far as the eye can see? Turns out those surpluses were transitory, stemming from capital gains taxes paid during the late innings of the tech bubble.
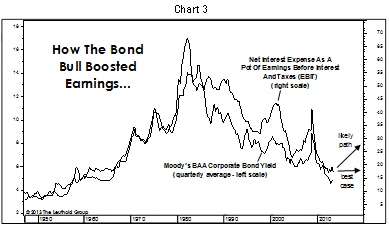
The bull market in bonds has provided a similar (although longer-term) benefit to corporate profitability. Net interest expense as a percentage of earnings before interest and taxes (EBIT) fell to 17.6% in this year’s second quarter -- down by half from a decade ago and significantly below the long-term median of 30.7% (Chart 3). Although corporate deleveraging the past several years has no doubt played a role, net interest expense basically mirrors the long-term trend in corporate bond yields. Even long-term bulls on bonds would have to concede that this key driver of profit margins has fully run its course. More likely, it’s set to reverse.
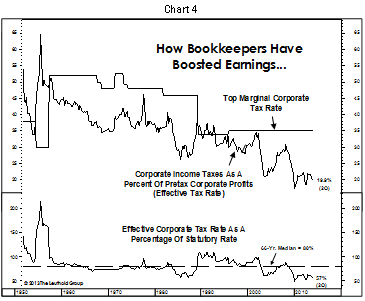
Margins have also benefited in recent years from the decline in another non-operating item -- corporate income taxes (Chart 4). Taxes plunged to 18.6% of pretax earnings during the depths of the Great Recession. Understandable. But the tax rate has remained depressed throughout the dramatic profit rebound of the last four years. Over time, the effective corporate tax rate has averaged about 80% of the prevailing top statutory rate (today’s is 35%). But the second quarter’s effective tax rate of 19.9% is far below this historical rule of thumb. The green eyeshade types, then, have been among the star players in the margin expansion “story.”
Again, the popular perception is that this cycle’s record margins stem from dramatic strides in corporate efficiency, driven in good part by the outsourcing of manufacturing/assembly operations to lower labor cost countries. But most margin expansion since the 1990s is attributable to a couple of other players -- specifically, the “Bond Bulls and the Bookkeepers” (we know, it sounds like a cheap romance novel).
The current NIPA corporate profit margin of 10.1% is well above the 7.3% high achieved during the 1990’s technology boom. But since late 1997, net corporate interest expense as a percent of “sales” (GDP) fell from 4.8% to 2.7% (Table 1). So the “Bond Bulls” are responsible for three-quarters of the 2.8% gain in net profit margins over the last 16 years! The “Bookkeepers” have played a lesser role, but have nonetheless contributed to another 40 basis-point gain in the net corporate profit margin (with corporate income taxes dropping to 2.5% of sales in Q2 2013, from 2.9% in 1997).
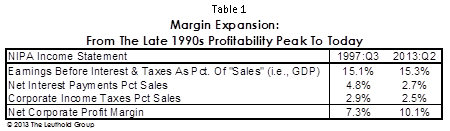
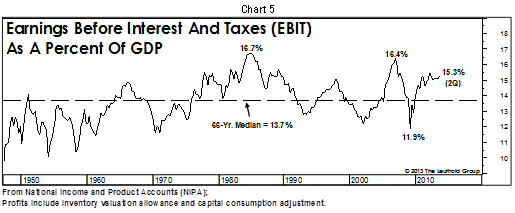
We are quantitative, industry-focused equity investors here at Leuthold -- not financial statement analysts. But even we immediately recognize the above trends as fairly “low quality” -- and unsustainable -- margin expansion. It’s clear that profitability gains at the operating level have been far more muted than commonly believed, with the “EBIT” margin rising only 20 basis points (15.1% to 15.3%) since the tech-era profitability peak.
In sum, the celebrated gains in corporate profitability over the past decade and a half are attributable primarily to proportional declines in “below the line” items like interest expense and corporate taxes. We don’t mean to minimize the scale of gains stemming from factory automation, offshoring and the like, but these operating strides have been required merely to preserve EBIT margins as Emerging Markets have become major players in manufactured goods.
The lone take-away we find for profit bulls is there’s still room for modest expansion in EBIT margins (Chart 5), which -- at 15.3% last quarter -- are still below their last cyclical peak (16.4% in 2006), and all-time peak (16.7% in 1984). These margin gains (if achieved) could be viewed as higher quality in nature than recent ones driven by declines in interest expense and corporate income taxes (and, bulls would say, therefore deserving of a higher P/E multiple).
© Leuthold Weeden Capital Management