Investing in a Fairly Valued World
For several years we have been arguing that global equity markets are undervalued and represent the best investment alternative given growing corporate profits (S&P 500 Index earnings have nearly doubled in the last five years), a favorable monetary backdrop and a recovering economy.
For the first time since the financial crisis we see most developed markets as fairly valued. The S&P 500 has reached our estimate of fair value on three occasions in the last three years (after which corrections followed) but the Euro crisis desynchronized the major global markets. Eurozone markets have caught up to the S&P 500 now that the crisis appears to be in the rearview mirror. Both the Shanghai Stock Exchange Composite Index and the Hang Seng Index currently trade at 11x earnings and are outliers as China faces a self-induced slowdown. Japan, at 24x earnings, is a special situation too as it undergoes a grand monetary experiment.
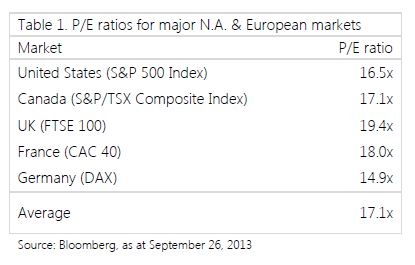
The current P/E ratios for the major North American and European markets are listed in Table 1. Why do we consider these current P/E ratios to be indicative of fair value? First, these values are hovering around their historical averages.
Second, a P/E ratio between 15-17x makes sense as a proxy for fair value once the ratio itself is deconstructed as,
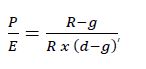
where R is the return on net assets, g is the long-term growth rate, and d is the discount rate. Inputting long-term values for each variable yields a P/E ratio between 15 – 18x. For example, assuming 5% earnings growth, return on net assets of 12% and a discount rate of 9%, yields a P/E ratio of 15.4x. In this light, it is easy to see how the P/E ratio rises as investors become more optimistic about the economic environment, raise their growth expectations and lower their acceptable discount rate.
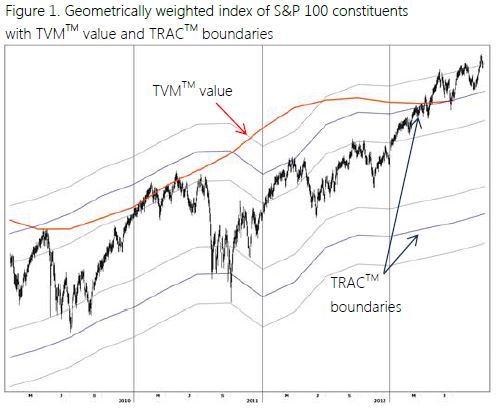
We also see the markets as fairly valued through the lens of our discounted cash flow valuation model, the Trapeze Valuation Model (TVMTM). TVMTM uses long-term historical margins and a growth rate derived from a combination of market implied growth and net asset growth. Figure 1 shows the TVMTM value for a geometrically weighted index comprising the S&P 100 constituents (as a proxy for the U.S. market). Also shown are the Trapeze Ratio of Adjusted Capital (TRACTM) boundaries.1
Now What?
While the market appears to be fairly valued, this is not necessarily bad news. History tells us that the markets are not doomed to fall sharply when trading in and around this P/E ratio. We examined historical 1-year and 2-year returns for four of the markets2 from Table 1 after they reached P/E ratios plus-or-minus 5% from their current levels. The subsequent average 1-year return is approximately 6% and the 2-year annualized return is close to 7%.
While not negative, these returns are nothing to write home about, especially when compared to the recent run up in equity prices. The average 2-year annualized return from current P/E levels is also weaker than the average 2- year annualized return of close to 10% for the four markets, irrespective of valuation.
So we’re not expecting doom and gloom, nor are we excited about stock markets in general. The economic backdrop remains favorable. Our economic model, the Trapeze Economic Composite (TECTM) has not given us a recession warning signal for the entire post-crisis bull market. It continues to flash green for all major markets around the world. In fact, the TECTM score has improved considerably over the last six months which is hopefully a precursor to accelerated economic growth. We are cognizant of the fact that corporate profit margins are at their all-time highs, a potential risk should the economy slow or experience a cost shock (e.g., energy spike or wage inflation) or rate hikes.
What We’re Doing
Active managers—value investors in particular—have found it difficult to beat their respective benchmarks as of late. As the saying goes, “a rising tide lifts all boats.” The latest leg of the current bull market has driven up the prices of most equities regardless of their intrinsic values which has negatively impacted the relative performance of value- minded investors and left fewer undervalued assets to purchase. According to JP Morgan, for the 12-month period ended June 30, 2013, U.S. active managers suffered their worst performance relative to benchmarks for any 12- month period since 1998. We believe now is the sweet spot for active investment management. With the markets at or near their fair values, active investors—especially value investors—should outperform.
Global large cap opportunities
It is much harder to find compelling ideas today than a year ago, however opportunities do exist. In our large cap Global Insight portfolio, since the end of the second quarter we purchased Newfield Exploration, Devry, Intel, Joy Global, Autodesk, Dean Foods, Samsung Electronics, Hewlett- Packard, Agrium, General Motors, Weatherford and Triumph Group. We sold Autodesk after it reported Q2 earnings and subsequently rose to our estimated fair market value. With the run up in equity markets, we parted with several other names including Kohl’s, Jabil Circuit, ThyssenKrupp, ADM, Teva, IBM, MetLife, AIG, Arrow Electronics, BMW, Cognizant, and Timken. NetGear and CST Brands were sold as sell signals were triggered in our TRACTM trading system.
Situations with catalysts
All of the recent portfolio additions trade at discounts to our estimates of fair market value. Of the portfolio additions mentioned, several have potential catalysts that could unlock value in the near term. Weatherford is in the midst of divesting underperforming businesses in order to maximize its leverage to the global demand recovery for oil and gas services. Management expects to close approximately $650 million of asset sales within the next twelve months, which should quickly bolster profitability. Similarly, Newfield is expecting bids for its international assets by the end of the month. The company expects to divest less than 15% of its production base for up to 30% of its enterprise value. Proceeds will be used to accelerate U.S. domestic liquids production, which is forecasted to grow at approximately 40% year over year. Agrium, the subject of a 10-month long proxy battle initiated by a U.S.-based hedge fund, continues to trade at a discount to our valuation. We believe that there is merit to the hedge fund’s proposal to separate the company’s retail and wholesale operations. At current price levels investors can purchase the less-volatile retail division and receive the optionality of the more- volatile, commodity-based wholesale operations for a nominal “stub” value.
Forgotten small caps
In our All Cap accounts, the area of concentration for the small and mid-cap selections continues to be the resource space. While the S&P/TSX Composite Index is trading close to fair value, the S&P/TSX Venture Index—as a proxy for small cap Canada—remains undervalued, down 27% over the last year and down over 70% from its 2007 high.
Shorting overvalued securities
The run up in markets has been difficult for short selling strategies. Many stocks now trade at significant premiums to their fair market values. Sectors we are currently focusing our research efforts on include financials, consumer retail, and technology. Our short exposure now sits close to 20% since opportunities are more abundant, the market appears to have limited valuation upside, and the U.S. market is at a ceiling in our TRAC work.
Conclusion
We expect market returns to be muted going forward, especially in comparison to the large run up since the bottom of the market during the financial crisis. We continually search for undervalued global large caps and under-the-radar small and mid-cap equities. We have increased our short exposure now that more compelling overvalued situations have materialized. Our short positions hedge our portfolios against unforeseen near term economic shocks. With the market’s margin of safety eroded by the general advancement of stock markets around the world, any negative development that causes investors to adjust risk premiums higher could have a forceful effect on equity prices.
1 TRACTM is a proprietary trading tool we use to optimize the timing of our buys and sells.
2 We used the earliest available historical Bloomberg data for the S&P 500, S&P/TSX Composite, DAX, and FTSE 100 to calculate our results. CAC 40
excluded due to insufficient data. The starting point and thus number of observations for the four markets varies. Returns are in local currencies and exclude dividends.
Disclaimer
The information contained herein is for informational and reference purposes only and shall not be construed to constitute any form of investment advice. Nothing contained herein shall constitute an offer, solicitation, recommendation or endorsement to buy or sell any security or other financial instrument. Investment accounts and funds managed by Trapeze Asset Management Inc. may or may not continue to hold any of the securities mentioned. Trapeze Asset Management Inc., its affiliates and/or their respective officers, directors, employees or shareholders may from time to time acquire, hold or sell securities mentioned. The information contained herein may change at any time and we have no obligation to update the information contained herein and may make investment decisions that are inconsistent with the views expressed in this presentation. It should not be assumed that any of the securities transactions or holdings mentioned were or will prove to be profitable, or that the investment decisions we make in the future will be profitable or will equal the investment performance of the securities mentioned. Past performance is no guarantee of future results and future returns are not guaranteed.
The information contained herein does not take into consideration the investment objectives, financial situation or specific needs of any particular person. Trapeze Asset Management Inc. has not taken any steps to ensure that any securities or investment strategies mentioned are suitable for any particular investor. The information contained herein must not be used, or relied upon, for the purposes of any investment decisions, in substitution for the exercise of independent judgment.
The information contained herein has been drawn from sources which we believe to be reliable; however, its accuracy or completeness is not guaranteed. We make no representation or warranties as to the accuracy, completeness or timeliness of the information, text, graphics or other items contained herein. We expressly disclaim all liability for errors or omissions in, or the misuse or misinterpretation of, any information contained herein.
All products and services provided by Trapeze Asset Management Inc. are subject to the respective agreements and applicable terms governing their use. The investment products and services referred to herein are only available to investors in certain jurisdictions where they may be legally offered and to certain investors who are qualified according to the laws of the applicable jurisdiction. Nothing herein shall constitute an offer or solicitation to anyone in any jurisdiction where such an offer or solicitation is not authorized or to any person to whom it is unlawful to make such a solicitation.
© Trapeze Asset Management