Long/Short Equity in Rising Rate Environments
The following insight from Kurt Voldeng, CAIA, Chief Operating Officer of Commerce Asset Management and portfolio manager of the AdvisorShares QAM Equity Hedge ETF (QEH), discusses the long/short fund universe.
The party in fixed income has been a good one. Spanning approximately 30 years and touching four different decades dating back to the Volker Era in the early 1980’s, it has been a fairly smooth ride with few, short lived, painful periods. It now appears that possibly, and the market pundits are still debating, that the party may be over. Most agree that if not over yet, the end is near. The most recent volatility that started in May and ran thru the end of August was a wake-up call for some and an “Ah hah!” moment for others. Regardless of which point of view investors may have, the logical question to consider is this, “where can I put capital that can earn a decent return without taking too much risk?” Equities have been touted as the most logical as dividend yields for large cap stocks are near that of 10 year Treasuries, however, the volatility of long only stock portfolios may be too much for fixed income allocations and 2008 still lingers in many investors’ memory. In this article we would like to revisit the world of long/short equity investing. This area has lost some of its luster in recent years when compared to the stellar performance of the S&P 500, however, most investors cannot handle the volatility of the beloved index and the merit behind the record highs are coming into question. If these three scenarios are becoming more and more likely (rising rates, fully or overvalued market, rising volatility), wouldn’t long/short equity be the answer?
Looking back to 1990, when hedge fund data was first indexed, we are able to examine the returns of a long/short equity universe of managers (in this case the HFRI Equity Hedge (Total) Index) compared with that of the Barclays Aggregate Bond Index during periods of rising interest rates (defined by moves in the 10 year US Treasury yield). We use the Barclays Aggregate Bond Index as we recognize that most investors have fixed income investments other than simply US Treasuries.
Figure 1
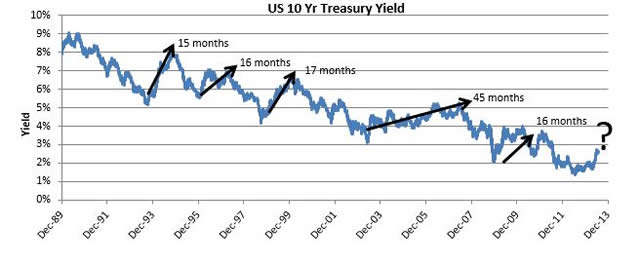
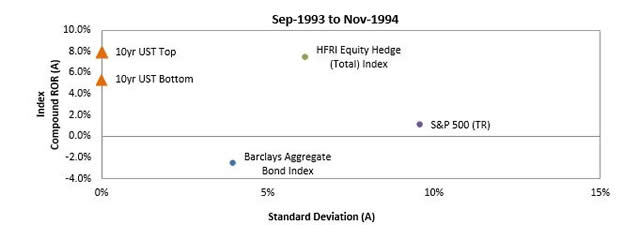
As can be seen in Figure 1, from 1990 thru 2012, there have been five periods when the 10 year US Treasury yield rose over 1.25%. The length of time for each rise in rates varied from 15 months to 17 months with the exception being a 45 month increase in the early 2000’s. For further examination, we will look at each period individually. The first period was from September 1993 to November 1994, lasting 15 months when 10 year yields rose 2.52%, moving from 5.38% to 7.90%. While the yield cushion during this period helped, the Barclays Aggregate Bond Index returned -2.6% annualized while the HFRI Equity Hedge Index returned +7.4% annualized (see Figure 2).
Figure 2
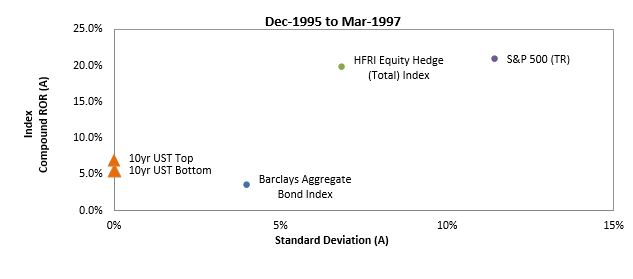
In the second period, lasting 16 months from December 1995 to March 1997, 10 year UST yields rose 1.33%, moving from 5.57% to 6.90%. During this period, the yield cushion was strong enough to keep the Barclays Aggregate Bond Index in positive territory earning an annualized 3.34%. At the same time, the HFRI Equity Hedge Index returned 19.7% annualized (see figure 3).
Figure 3
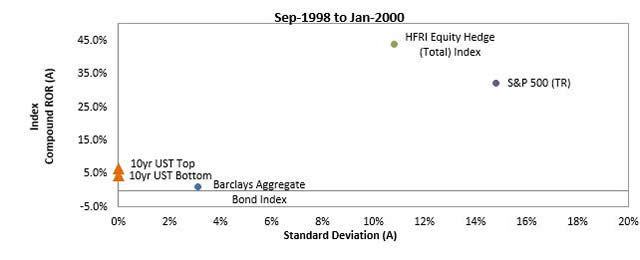
The third period, lasting 17 months, was from September 1998 to January 2000 with 10 year US Treasury yields rising 2.25% from 4.42% to 6.67%. During this period, the Barclays Aggregate Bond Index was able to eke out a positive return (+1.05%) while the HFRI Equity Hedge Index returned over 40% annualized (see figure 4).
Figure 4
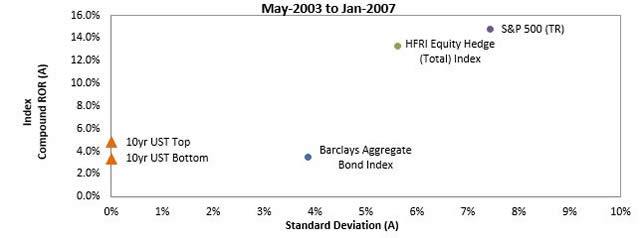
The fourth period, lasting an astounding 45 months from May 2003 to January 2007 saw rates grinding slowly higher by 1.44% from 3.37% to 4.81%. During this period, the Barclays Aggregate Bond Index was able to return +8.8% while the HFRI Equity Hedge Index returned 20.6% (see figure 5).
Figure 5
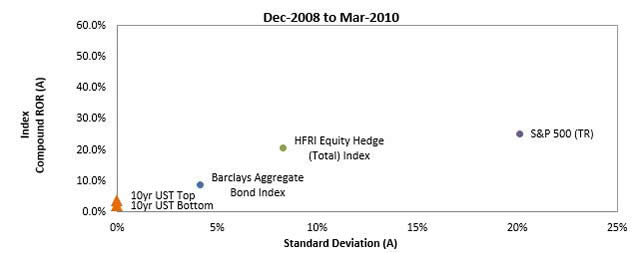
The fifth period, from December 2008 to March 2010 and lasting 16 months, saw 10 year US Treasury yields rise 1.61%. During this period, the Barclays Aggregate Bond Index returned nearly 10% while the HFRI Equity Hedge Index returned nearly 20% (see figure 6).
Figure 6
Conclusion
As the yield cushion has decreased over the years, the ability for fixed income investments to generate positive returns in rising rate environments gets tougher and tougher.
The most recent rise in rates from May to August of this year sent shockwaves through the fixed income markets. While this move in rates was the result of market participants anticipating the removal of the Fed’s bond purchasing and its desire to keep rates low for an extended period of time, it was most likely an overreaction and will take some time for the market to find a range where rates should be in the near term. Short spikes in rates like this are unpredictable, traumatic, and cause various dislocations across multiple markets. This was true in the May to August period. The Barclays Aggregate Bond Index was down -3.66% for the four month period while the HFRI Equity Hedge Index was +1.1%.
As we all know, the past is the past, however, in fixed income, math is math. When rates rise, prices fall and only yield and spread compression can cushion that fall. Currently, the yield cushion is not something to take comfort in. While long/short equity rarely keeps pace with strong equity rallies, it does participate and does so with less volatility. Maybe it is time to rethink long/short equity.
Commerce Asset Management, LLC is an investment advisory firm registered with the SEC. CAM focuses on alternative investment strategies and custom hedge fund advice. CAM manages long/short fund of funds and hedge fund replication strategies in addition to providing consulting to multi-manager hedge fund portfolios.
Past performance is not indicative of future results.
These materials shall not constitute an offer to sell or the solicitation of an offer to buy. Such an offer to sell or solicitation of an offer to buy interests may only be made pursuant to an advisory agreement between Commerce Asset Management, LLC and an investor. The information in this presentation is provided as of the date hereof and is subject to change at anytime after the date hereof.
Source: Hedge Fund Research, Inc. www.hedgefundresearch.com, © 2013 Hedge Fund Research, Inc. All rights reserved.
© Advisor Shares