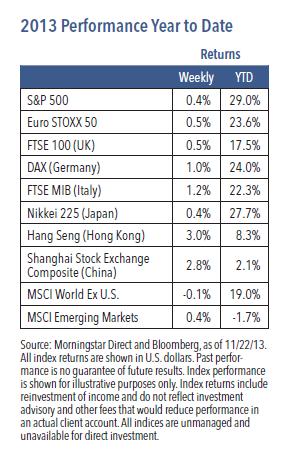
U.S. equities finished higher again last week as the S&P 500 increased 0.4%.1 The Fed continued to dominate headlines, with heightened emphasis on the distinction between tapering and tightening. Bubble speculation continued to receive attention in the press, while many articles refuted such concerns. The financial sector performed well, led by banks.2
Accelerating Earnings Growth Could Spark Change
Third quarter earnings results showed an increase in manufacturing activity across nearly every large economy, as earnings growth in cyclical sectors (excluding energy) outpaced defensive sectors. Every defensive sector lagged the overall S&P 500 Index, while all cyclicals (excluding energy) outpaced the Index and the rate-sensitive sectors continued to thrive.2 In terms of share price gains, cyclicals have been outperforming defensives since the end of the first quarter,2 but analysis reveals the outperformance has been based on multiple expansion rather than earnings. This implies cyclical stocks have room to grow if they can build on this quarter’s earnings outperformance.
A key development is the apparent acceleration in the growth rate of S&P 500 revenue and earnings. Although one quarter does not make a trend, the third quarter marked the first in six quarters in which revenue growth moved out of a near zero range. More data is needed to confirm an inflection, but an improvement would sup- port higher stock prices and take pressure off of multiple expansion.
Weekly Top Themes
1. Fourth quarter retail spending is off to a good start: October total retail sales beat expectations and rose 0.4%.3 Retail sales, along with the relatively posi- tive October employment report, indicate minimal impact from the government shutdown. The supportive data appears to balance some of the downside risk to fourth quarter GDP.
2. We anticipate either another year of sequester or a deal in December, although it is not certain. We intend to plan for upcoming fiscal restraint. Government receipts are still in solid territory, and new deficit projections from the Congressional Budget Office will show even more progress than expected.4
3. The Democratic majority in the Senate substantially changed filibuster rules to prevent the Republican minority from blocking Presidential nominees to government agencies. The change includes the Fed and courts other than the Supreme Court. It will enable the Obama administration to use executive branch powers aggressively but could damage the atmosphere in the Senate, making major legislation such as comprehensive immigration reform less likely.
The Big Picture
Global growth is improving,5 and we believe it will accelerate in 2014. Progress will be underpinned by diminishing fiscal drag, consumer recovery in the United States and Europe and modest increase in corporate capital expenditures. We are more optimistic about China, where recently announced economic and social reforms should improve economic growth and stability. Risk assets have continued to rally as the Fed and European Central Bank (ECB) emphasize a commitment to a low interest rate environment. We expect the Fed to taper, or reduce, its asset purchases in the first quarter. We perceive that a repeat of the May/June correction is unlikely, since valuations and positioning have largely adjusted. In the Eurozone, the ECB delivered a surprise rate cut, signaling both a clear divergence from Fed action and continued policy support. The emerging gap between the two central banks should underpin a stronger U.S. dollar.
Equities continue to run higher, as volatility across all asset classes has fallen to pre- crisis levels.6 Despite rising concerns over market bubbles, equity valuations remain close to long-term averages and equities appear inexpensive relative to fixed income.2 Accommodative central bank policies can probably support near-term prices, but sustained appreciation will likely require stronger economic growth to subsequently boost corporate earnings. We do expect growth to materialize, and future returns will likely be positive yet muted, as well as more dependent on stock selection.
1 Source: Morningstar Direct, as of 11/22/13. 2 Source: FactSet, as of 11/22/13. 3 Source: U.S. Census Bureau, U.S. Department of Congress, “Advance Monthly Sales for Retail and Food Services October 2013,” November 20, 2013. http://www.census.gov/retail/. 4 Source: Congressional Budget Office, “Options for Reducing the Deficit: 2014 to 2023,” November 2013. http://www.cbo.gov/ publication/44715. 5 Source: U.S. Department of Commerce Bureau of Economic Analysis, “National Income and Product Accounts Gross Domestic Product, 3rd quarter 2013 (advance estimate),” November 7, 2013, http://www.bea.gov/newsreleases/national/gdp/gdpnewsrelease.htm. 6 Source: Bloomberg. Volatility as measured by the VIX Index, an index designed to track S&P 500 volatility.
The S&P 500 Index is a capitalization-weighted index of 500 stocks designed to measure the performance of the broad domestic economy. Euro STOXX 50 Index is Europe’s leading Blue-chip index for the Eurozone and covers 50 stocks from 12 Eurozone countries. FTSE 100 Index is a capitalization-weighted index of the 100 most highly capitalized companies traded on the London Stock
Exchange. Deutsche Borse AG German Stock Index (DAX Index) is a total return index of 30 selected German blue chip stocks traded on the Frankfurt Stock Exchange. FTSE MIB Index is an index of the 40 most liquid and capitalized stocks listed on the Borsa Italiana. Nikkei 225 Index is a price-weighted average of 225 top-rated Japanese companies listed in the First Section of the Tokyo Stock Exchange. Hong Kong Hang Seng Index is a free-float capitalization-weighted index of selection of companies from the Stock Exchange of Hong Kong. Shanghai Stock Exchange Composite is a capitalization-weighted index that tracks the daily price performance of all A-shares and B-shares listed on the Shanghai Stock Exchange. The MSCI World Index ex-U.S. is a free float-adjusted market capitalization weighted index that is designed to measure the equity market performance of developed markets minus the United States. The MSCI Emerging Markets Index is a free float-adjusted market capitalization index that is designed to measure equity market performance of emerging markets.
RISKS AND OTHER IMPORTANT CONSIDERATIONS
The views and opinions expressed are for informational and educational purposes only as of the date of writing and may change at any time based on market or other conditions and may not come to pass. This material is not intended to be relied upon as investment advice or recommendations, does not constitute a solicitation to buy or sell securities and should not be considered specific legal, investment or tax advice. The information provided does not take into account the specific objectives, financial situation, or particular needs of any specific person. All investments carry a certain degree of risk and there is no assurance that an investment will provide positive performance over any period of time. Equity investments are subject to market risk or the risk that stocks will decline in response to such factors as adverse company news or industry developments or a general economic decline. Debt or fixed income securities are subject to market risk, credit risk, interest rate risk, call risk, tax risk, political and economic risk, and income risk. As interest rates rise, bond prices fall. Non- investment-grade bonds involve heightened credit risk, liquidity risk, and potential for default. Foreign investing involves additional risks, including currency fluctuation, political and economic instability, lack of liquidity and differing legal and accounting standards. These risks are magnified in emerging markets. Past performance is no guarantee of future results.
Nuveen Asset Management, LLC is a registered investment adviser and an affiliate of Nuveen Investments, Inc.
© Nuveen Asset Management