Automation and Lean Manufacturing: Boost Profits, Squeeze Employment
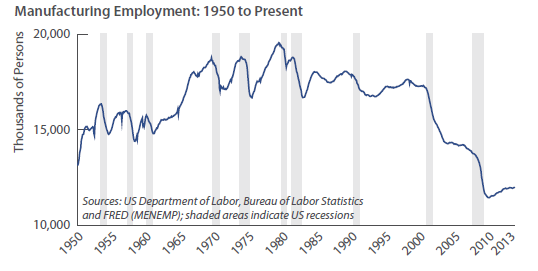
Despite industrial production reaching all-time highs in August of this year,1 employment in the manufacturing sector remains substantially below levels witnessed before the 2008–2009 recession. When looking at longer term employment trends in manufacturing, it becomes clear that companies increasingly boost production without adding incremental labor. Profit margins, while not yet recovered to pre-recession peaks, endure at historically high levels. Several long-term changes in the manufacturing economy contribute to this divergence: outsourcing, automation, and lean manufacturing.
Prior to the 2001 recession, manufacturing employment followed a predictable cyclical pattern: contraction during recessions followed by strong recovery in subsequent years. However, beginning with the March 2001 recession, manufacturing employment has faltered and remains at depressed levels.
Trends in outsourcing have had the largest impact on labor-intensive industries such as apparel and textiles. Textile and fabric mill employment fell from 773,000 in 1987 to 254,000 in 2011, while apparel-related manufacturing period. The comparative labor advantage of low-cost countries, such as China, has proven irresistible for manufacturers of relatively homogeneous, technologically undifferentiated products.
Despite outsourcing fears, however, the US remains a manufacturing powerhouse with record levels of industrial output. Since the government began tracking data in 1992, capital goods shipments per manufacturing employee have been on an inexorable march higher, increasing from an average of $2,800 per month per employee in 1992 to nearly $6,900 in 2012.2
So, how are industrial firms able to generate ever-higher levels of increased automation and the proliferation of lean manufacturing throughout the industrial economy. The answer, we believe, is increased automation and the proliferation of lean manufacturing throughout the industrial economy.
We are still a long way from running the so-called “lights-out”3 factories envisioned in the early 1980s by then General Motors CEO Roger Smith as a competitive response to the rise of Japanese auto manufacturers. There are signs, however, that manufacturers are increasingly using robotics and automation for tasks once accomplished by laborers. In early 2004, the Robotics Institute of America estimated that 137,000 robots toiled tirelessly on the factory floor.4 By the end of the third quarter 2013, that number increased to 230,000, representing a 5.6% annualized growth rate.5 Manufacturers have also improved production efficiency through the use of programmable logic controllers and computer numerical controls to aid production. This partially explains why private, nonresidential investments in equipment and software have increased 29% since 20096 while manufacturing employment growth remains tepid coming out of the 2008–2009 recession.
The rise of automation has been particularly unkind to workers with lower levels
of education. From 2000 to 2012, all workers in manufacturing faced a 23% decline in employment, much of which was concentrated among workers with less than
an associate degree (-18.0%). Workers with bachelor’s degrees (-6.5%) and higher (+19.0%) were much more resilient. The increasing use of ever more sophisticated automation spells doom for those without the requisite skills to implement, maintain, or interpret the machines. 7
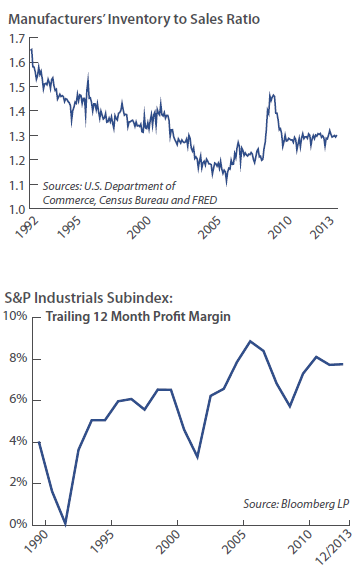
Lean manufacturing’s impacts on employment are also widespread, though difficult to quantify. While Toyota’s Taiichi Ohno pioneered lean techniques with his Toyota Business System, industrial companies have adopted lean manufacturing on a broad scale. This has lead to nimbler supply chains, just-in-time inventory and batching, elimination of waste, and constant demand for cost reductions from business units. The effects of lean manufacturing contribute to employers’ reticence to hire, given that they can make their existing labor force more efficient through continuous improvement and by requiring less inventory to generate each dollar of sales. As larger companies adopt lean principles throughout their supply chains, they create a vicious cycle where fewer and fewer employees are needed throughout the production process. This effect is perhaps best illustrated by the declining ratio of manufacturers’ inventories to sales over time. Though the ratio is a bit higher than pre-2009 recession levels, the trend of lower inventories has been fairly consistent since data collection started in 1992.
Doing more with less has kept capacity utilization stubbornly low, reaching only 77.5% in October.8 If the global economy continues to mend itself and production marches higher, companies may have to spend more to increase productive capacity. Trends in automation and lean manufacturing point to a higher likelihood that companies will invest in fixed capital as opposed to more labor.
The effects of employing increasingly sophisticated technologies and supply chain methodologies appear to be driving higher peak- to-trough profitability for industrial companies. As a result, industrial profit margins have been higher in each of the last two recessions.
Implications for Investors
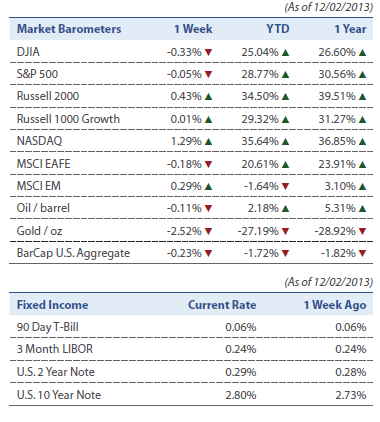
Investors may be adjusting to the new reality of higher “through-the- cycle” profitability. The S&P 500 industrials sub-index is up 105.3% from March 2001 to September 2013 versus the S&P 500’s 85.2% return. Currently companies within the S&P 500 industrials index are trading at 18.5 times trailing twelve month earnings compared to a historical median of 19.3 times. As investors recognize what may be a structural shift in profitability, historical valuations applied to cyclical equities may prove too pessimistic. At current valuations, we do not consider industrial companies expensive. While profitability held up well in the past two recessions, we will look to future cycles of industrial production decline for evidence of a permanent structural change. As businesses increasingly invest their capital to drive efficiencies and profitability, companies with exposure to automation and tightly controlled supply chains should do well. Companies without the foresight to fully implement automation and lean manufacturing are likely to fall behind.
Footnotes
1 FRED Database, series INDPRO
2 FRED Database, series UTCGVS / MANEMP
3 “Lights-out” is terminology used for a fully automated factory with no human presence.
4 Robotic Industries Association.“North American Robot Orders Jump 17% in First Quarter of 2004,” May 4, 2004.
5 Robotic Industries Association.“North American Robotics Shipments Up, Orders Down for First Nine Months of 2013,” October 29, 2013.
6 FRED Database, series NRIPDCA
7 Levinson, Marc.“Job Creation in the Manufacturing Revival,” Congressional Research Office, June 19, 2013.
8 FRED Database, series MCUMFN
Important Disclaimers and Disclosures
This report is intended only for the information of the reader and is not to be used for or considered as an offer or the solicitation of an offer to sell or buy any securities or other financial instruments of any kind, including without limitation, any mutual fund or other product offered, sponsored, created, or managed by Saturna Capital Corporation or its subsidiaries or affiliates (“Saturna”). This report is not intended for distribution to, or use by, any person or entity who is a citizen or resident of, or located in, any locality, state, country, or other jurisdiction in which such distribution, publication, availability, or use would be contrary to law or regulation or which would subject Saturna to any registration or licensing requirement within such jurisdiction.
This document should not be considered as providing investment advice or services, or any other service offered by Saturna. Saturna may not have taken any steps to ensure that the securities referred to in this report are suitable for any particular investor. Saturna will not treat recipients as its customers by virtue of their reading or receiving the report.
Nothing in this report constitutes investment, legal, accounting, or tax advice or a representation that any investment or strategy is suitable or appropriate to a particular investor’s circumstances or otherwise constitutes a personal recommendation to any investor. Saturna does not offer advice on the tax consequences of any investment.
All material presented in this report, unless specifically indicated otherwise, is under copyright to Saturna. None of the material, nor its content, nor any copy of it, may be altered in any way, transmitted to, copied, or distributed to any other party without the prior express written permission of Saturna. Unless otherwise indicated, all trademarks, service marks, and logos used in this report are trademarks or service marks of Saturna.
The information in this report was obtained from sources Saturna believes to be reliable, and Saturna believes the information and opinions in the material are accurate and complete as of the date of this material. However, information and opinions contained herein will change over time and without notice. Saturna has no obligation to update or amend any information or opinions at any time. Saturna makes no representations as to the accuracy or completeness of this material, nor does it have any responsibility to ensure that any other materials, including any containing materially different information, are brought to the attention of any recipient of this report.
Under no circumstances shall Saturna, its employees, or any affiliate be responsible for any investment decision by any recipient. This material is distributed on condition that it will not form the sole basis or a sufficient basis for any investment decision by any recipient. Any recipient who is not a market professional or institutional investor should seek the advice of an independent financial adviser prior to making any investment based on this report or for any necessary explanation of its contents.
Saturna does not provide tax, legal, or accounting advice. Investors should consult their own tax, legal, and accounting advisers before engaging in any transaction. In compliance with IRS requirements, recipients are notified that any discussion of US federal tax issues contained or referred to herein is not intended or written to be used for the purpose of (A) avoiding penalties that may be imposed under the Internal Revenue Code; nor (B) promoting, marketing, or recommending to another party any transaction or matter discussed herein.
The Dow Jones Industrial Average is a price-weighted index of 30 of the largest, most widely held US stocks. The S&P 500 is an index comprised of 500 widely held common stocks considered to be representative of the US stock market in general. The Russell 1000 Growth index is a widely recognized index of large-cap growth stocks. The Russell 2000 Index is comprised of US small cap stocks and measures the performance of the 2,000 smallest US companies in the Russell 3000 Index. The NASDAQ Composite index measures the performance of more than 5,000 US and non-US companies traded “over the counter” through the National Association of Securities Dealers Automated Quotation system. The MSCI EAFE Index, produced by Morgan Stanley Capital International, measures the equity market performance of developed markets in Europe, Australasia, and the Far East. The MSCI Emerging Markets Index, produced by Morgan Stanley Capital International, measures equity market performance in over 20 emerging market countries. Barclay’s Capital US Aggregate Bond Index measures the performance of the US bond market. All indices shown are widely recognized unmanaged indices of common stock prices that reflect no deductions for fees, expenses, or taxes. Investors cannot invest directly in the indices.
Past performance does not imply or guarantee future performance, and no representation or warranty, express or implied, is made regarding future performance. The price for, value of, and income from any of the securities or financial instruments mentioned in this report can fall as well as rise. The value of foreign securities and financial instruments is subject to exchange rate fluctuations that may have a positive or negative effect on the price or income of such securities or financial instruments. Investors in securities such as American Depositary Receipts – the values of which are influenced by currency volatility – effectively assume this risk.
© Saturna Capital
www.saturna.com