Sitting On The Secular Fence
At the January highs, the S&P 500 had gained almost 175% in just 58 months, while secondary stocks and equal-weighted market measures have gained considerably more. If it’s already over (and we don’t think it is), this cyclical bull will go down as a memorable one. But is this move the first leg of a new secular bull market? For a firm that enjoys its market history, we sheepishly admit we don’t have a definitive answer.
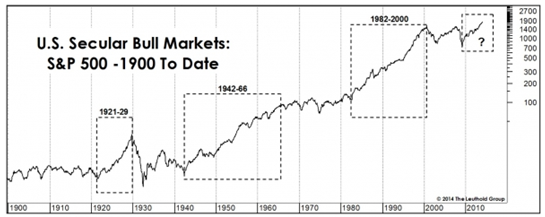
Last year’s huge gains seemed to cement consensus opinion that a new secular bull is now underway, and the rally to date certainly stacks up favorably with the first five years of the three Twentieth Century secular bulls (Chart 1). All major indexes besides the NASDAQ have been trading in record high territory for at least the last 10 months, further undermining the case that the secular bear begun in 2000 is still in force.
Chart 1
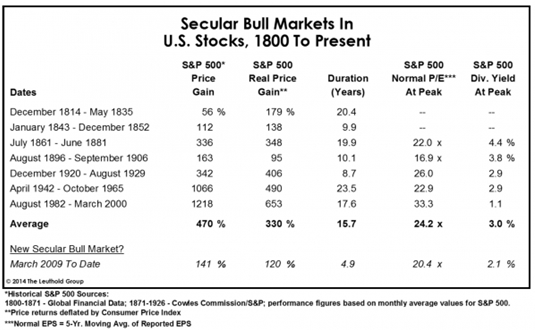
Analysis of any secular phenomenon is necessarily hampered by data availability. Even a dive into our deepest historical capital markets database yields a sample of only seven completed secular bull markets, and many would consider the first three (if not four) of these to be irrelevant (Table 1). We tend to err on the side of too much history than not enough; human nature doesn’t change.
We’ve tentatively added the 2009-to-date rally to this long-term compilation of secular bulls. The current bull has lasted about a third as long as the median secular upswing of 15.7 years and has also delivered about a third of the median cumulative price return of +470%. But current valuation statistics aren’t consistent with this portrait of youth; today’s S&P 500 Normalized P/E is about four points below the median level from the last five secular peaks (20.4x versus 24.2x).
Table 1
The last two secular bull markets (1942-1965 and 1982-2000) established hurdles that today seem impossibly high, with the S&P 500 rising more than eleven-fold in both cases. But we worked out some market math for the “median” scenario (and please consider this merely a mental exercise):
1. Assume S&P 500 Normalized EPS grow at their 6% historical rate over the next 10.8 years—allowing the secular bull to reach its median length of 15.7 years. This equates to EPS of $164.12, off today’s base of $87.47.
2. Given those EPS, what “Normalized” P/E would be required to produce the median +470% price gain from the past seven secular bulls? The answer is 23.5x—which is near the median secular valuation peak of 24.2x. This translates to an S&P 500 price target of 3856.
3. Given the S&P 500 target, the compound price return 10.8 years out would be 7.4%. Tacking on today’s S&P 500 dividend yield of 2.1% gives a projected total return of 9.5% annualized out to late 2024. Not bad… Now let’s try to pick this apart.
A total return of 9.5% over the next ten-plus years sounds great to us. But it falls short of the long-term total return average of about 10% found in both the Ibbotson data (1926 to date) and the Cowles Commission’s S&P 500 extension back to 1871.
Further, one could reasonably question our assumption of annualized nominal growth of 6% in S&P 500 Normalized EPS. That figure comes from our modern era (1957-to-date) data set, but the compound growth rate drops to 5.3% when the series is extended back to 1926. On the other hand, the “terminal P/E” of 23.5x we calculated wouldn’t be unreasonable for the top of a secular bull market. (That figure ranks in the 92nd percentile of all observations back to 1926.)
The bottom line: If the current cyclical bull unfolds into a secular one that is perfectly average in duration and magnitude (a very tall achievement, in our book), the annualized total return over the next ten years will still be a bit below the long-term average return of 10%. Frankly, we don’t find this all that compelling, considering all that must go according to plan for the market to achieve it (i.e. sustained EPS growth at a healthy 6% and an inflated terminal P/E multiple).
The Bears’ Turn
A handful of analysts have contended the March 2009 low was not secular in nature—although their ranks thinned considerably in 2013. They claim the 2000-09 decline was simply too short to sufficiently purge the excesses built up during history’s most powerful secular bull. They have a point: The four previous secular bears lasted from 12 to 17 years even though all four commenced from far less inflated valuations than those recorded at the 2000 peak.
Similarly, the remaining secular bears argue that U.S. stock market valuations never sank to levels befitting a true secular buying point. That’s debatable. At the intraday low of March 6, 2009 (the infamous “666”), the S&P 500 traded at just 10.1x our 5-yr.Normalized EPS estimate—only half a point above the median P/E of 9.6x seen at the last four secular bear market lows. Close enough for government work, in our view. On the other hand, the S&P 500 dividend yield at that historic low amounted to just half the median of 6.7% seen at the prior four lows.
Table 2
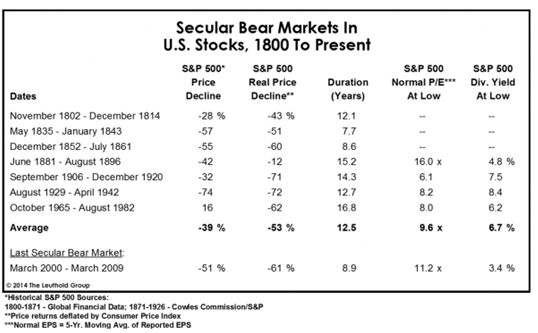
We expect that the March 2009 levels reached by essentially all of our key U.S. valuation measures will prove to be lasting secular lows. In the context of zero interest rates and (at the time) zero inflation, it was probably unreasonable to expect valuations to match those seen in conjunction with the double-digit interest rates and inflation at the 1982 low.
Chart 2
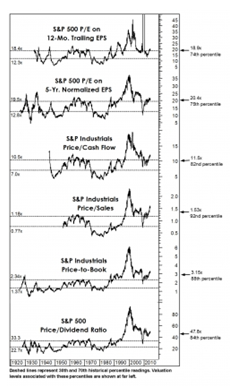
Our concern is not with the troughs of 2009, but where those valuations stand a mere five years into the supposed secular upswing. Even the P/E on forward EPS—though not a serious valuation tool—has returned to its late 2007 highs, and those measures with actual predictive ability don’t look any better.
All six of the accompanying valuation ratios are strongly (and negatively) correlated with subsequent 10-year stock returns, and the least extreme among them (the S&P 500 12-Mo. Trailing P/E) still stands higher than about three-quarters of its history—with those earnings lifted by margins higher than 100% of their history. Three measures (Price/Cash Flow, Price-to-Book, and Price/Dividend) have moved into their ninth historical decile, and the S&P Industrials Price/Sales ratio is now on a path into late-1990s bubble territory.
Based on the relative positions of these time-tested measures, secular bulls seem to be implicitly betting on the reflation of a multi-generational stock bubble less than 15 years after it popped. The pathology of “busted bubbles”—which we’ve detailed at length in the past—doesn’t support that bet.
From a fundamental perspective, many contend the secular bear must be intact because its underlying basis—the U.S. debt overhang—has yet to be extinguished. (Or, as Gordon Gekko might say, it’s “simply transferred from one perception to another” i.e., from consumers to the federal government, and from the government to the Fed.)
We’re sympathetic to this argument. Despite an economic expansion well into its fifth year and two consecutive years of nominal cuts in federal outlays, the federal debt has still climbed $900 billion in the last 12 months to $17.3 trillion. The arithmetic will undoubtedly become scary during the next economic downturn, the catalyst—bears would contend—for a valuation collapse to true secular lows. This may be difficult to imagine with faith in the Fed’s debt monetization now at a high level, but that faith will undoubtedly be shaken in the next few years (or possibly months).
Conclusions
While we think and write about the market’s secular outlook frequently, remember that our tactical asset allocation tools are cyclical in nature. The objective of the Major Trend Index and related disciplines is to help us identify and capture the primary stock market swings associated with economic expansions and contractions. A secular bull or bear market generally encompasses two or more completed business cycles, a horizon that is impossibly long for tactical decision making.
That disclaimer having been made, scenario analysis helps prepare us for what we might eventually be forced to reckon with. We think the next cyclical bear market will drive the market to levels low enough that debate will rage (if only among market students) over the true date of the secular bear market low: was it 2009, or 201X?
Assume the current cyclical bull market tops out some time in 2015 with the S&P 500 reaching “round number resistance” at 2000. (This equates to a triple off the intraday bear market low.) Then, suppose a “garden variety” cyclical bear market erupts during 2015-2016, driving the market down 30% to 1400.
Yes, 1400 is more than twice the March 2009 secular price low, but it’s almost 10% below the March 2000 nominal high of 1527. Plus, the accumulated loss of purchasing power over 16 years would take a toll of another 25% or so. Such a stock market low (which is purely our conjecture, obviously) might well feel like a new secular trough.
Fortunately, forecasts are just for show.


