Prepayments and Value in the Non-Agency Market
Non-agency mortgage bond investors look to voluntary prepayment projections as an essential component of assessing future cash flows and returns. Voluntary prepayments are the annualized percentage of the mortgage pool that leaves the pool each month due to refinancing or paying off a mortgage without a loss. Without equity in the home, it is nearly impossible for a non-agency borrower to refinance the mortgage and the sale of a home would generate a loss through a short sale or foreclosure. Hence, voluntary prepayment rates are low compared to historical norms, largely due to the decline in home prices that occurred from Q3 2006 to Q1 2012. Figure 1 shows how the decline in home prices directly impacted the non-agency voluntary prepayment dynamic.
Figure 1
Non-Agency Voluntary Prepays vs Case Shiller Home Price Index

Source: TCW, S&P Case Shiller, Corelogic
As home prices were rising during the early 2000s, voluntary prepayment rates reflected “normal” non-agency prepayment behavior across all sectors. During this time, the typical drivers of voluntary prepayments (rate incentive and turnover) were in play. Since the dramatic decline in home prices, those without equity have been unable to refinance or move without a loss despite the existence of substantial rate incentive and “pentup” turnover demand. The average mortgage rate across the legacy non-agency universe is 5.4% compared to the current 30-year zero point mortgage available at 4.3%. Those borrowers who are most “underwater” (subprime and option ARM) experienced the largest decline in voluntary prepayment behavior. For example, subprime prepayments averaged 35% during 2005 and averaged only 3% during 2013. Moreover, these distressed borrowers have had voluntary prepayment rates below the 5% long-term turnover average since Q4 2008 creating substantial “pent-up” turnover demand.
However, as equity returns via amortization and home price appreciation, voluntary prepayment rates will rise and contribute significantly to returns. We will discuss what the market is projecting as well as our own base and bullish cases for voluntary prepayment rates.
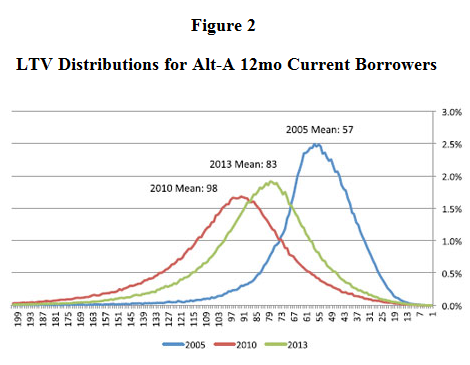
Since Figure 1 helps elucidate what our intuition tells us: that one can’t refinance a loan with a loan to value ratio (LTV) greater than 100%, it make sense to explore the relationship between LTV and voluntary prepayments in a more granular fashion. We will begin by focusing on the Alt-A sector. Figure 2 shows LTV distributions for different segments of the Alt-A market at different points in time.
Figure 2
LTV Distributions for Alt-A 12mo Current Borrowers
Source: TCW, Corelogic, TrueLTV
First, we chose a period in time when Alt-A borrowers had plenty of equity in the home, easy access to credit and voluntary prepayment rates between 20-30%. The 2005 distribution represents Alt-A borrowers who had not missed any payments in the last 12 months (12mo Current) as of February 2005. This segment of borrowers represented over 93% of the Alt-A market at the time. The distribution of its LTVs is shown in blue and had a mean of 57%. This distribution had a 12-month voluntary prepayment rate of 32% driven largely by turnover and rate incentive.
Second, we shift our focus to Alt-A loans originated as the home prices were peaking (2005-2007 vintages). The 2010 distribution in red represents 12mo Current Alt-A borrowers from the 2005- 2007 vintages as of November 2010. This segment of borrowers represented 59% of the Alt-A market at the time. The distribution of its LTVs is shown in red and had a mean of 98%. Because of the lack of equity and restricted access to credit, this distribution of clean-pay borrowers had voluntary prepayments of 4% during the subsequent 12 months despite having an average of 120 basis points of refinance incentive. Clearly, the shift in LTVs and the concomitant loss of equity had a substantial impact on borrowers’ ability to voluntarily prepay their mortgages through home sales or refinancings.
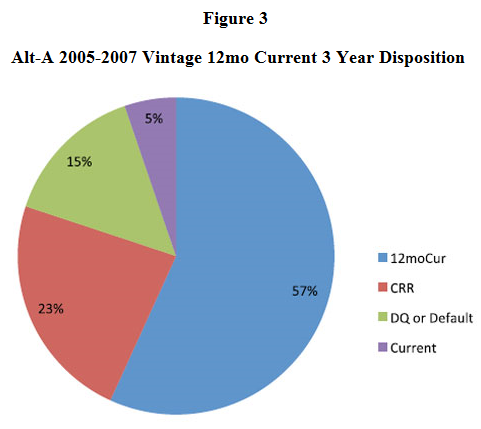
Third, as home prices began to find a bottom in 2010 we can observe how borrowers behaved over the subsequent three years. Through amortization and home price appreciation, these loans would have had a mean LTV of 83% as shown in the green distribution. However, not all of these loans were still outstanding 12mo Current borrowers as of November 2013. Some voluntarily prepaid, some liquidated with a loss and some experienced varying degrees of delinquency as seen in Figure 3¹.
As prices bounced along the bottom in 2010 and began to rise in Q1 2012, underwater borrowers began to regain equity in their homes, which unlocked refinancing opportunities. Over the three-year period from 2010 to 2013 23% of the loans prepaid voluntarily, which, when annualized, equates to 7% per year for borrowers in this selection. Notably, during the last third of this 36-month period voluntary prepayment rates were 13% among these borrowers while home prices were rising robustly and mortgage rates were reaching historic lows.
Figure 3
Alt-A 2005-2007 Vintage 12mo Current 3 Year Disposition
Source: TCW, Corelogic, TrueLTV
We gain even more insight into the influence LTV has on voluntary prepayments by analyzing the last 12-month voluntary prepayment rate by LTV. Figure 4 shows the prepayment rate for 2005-2007 vintage Alt-A 12mo Current borrowers by LTV.
Figure 4
Alt-A 12mo Current 2005-2007 Vintage CRRs by LTV during 2013

Source: TCW, Corelogic, TrueLTV
Borrowers who have a clean pay history and equity in their homes prepaid at nearly four times the rate of borrowers who have no equity at all. Clearly, LTV is a strong predictor of voluntary prepayment behavior among non-agency loans.
As we look to the future we can generate projected LTV distributions based upon hypothetical home price appreciation assumptions. Figure 5 shows four LTV distributions for Alt-A loans.
Figure 5
Alt-A LTV Distributions

Source: TCW, Corelogic, TrueLTV
The 2013 distribution represents the current distribution of 2005-2007 vintage Alt-A 12mo Current loans with a mean of 94%. If we assume that the home price appreciation we experienced over the last three years (4.5% annually) is our projection for the next three years, the result is the Base 2016 distribution with a mean of 76. For our bullish case, we asked ourselves, “If we held 2013 HPA (13.6%) constant going forward, how long would it take to return the 2005-2007 Alt-A 12mo Current borrowers to the LTV distribution they had at the beginning of 2005?” The answer is three years and three months. If we assume that the home price appreciation we experienced over the last 12 months holds for three years and three months, we get a distribution (Bullish 2017) that looks just like the "healthy" 2005 Alt-A LTV distribution.
We use the prepayment LTV distribution above (Figure 4) to estimate future voluntary prepayments for 2005-2007 vintage Alt-A 12mo Current loans over the next three years. Assuming a 4.5% annual home price appreciation produces the Base 2016 distribution above, voluntary prepayments for 2005-2007 vintage Alt-A loans will be 11% per year compared to market expectations of 5%. This difference in voluntary prepayments would yield an additional 114 basis points of annual returns over three years versus market expectations (8.8% vs. 9.9%).
If we assume a bullish case for home prices by holding the last 12 month’s increase of 13.6% constant for the next three years our voluntary prepayment rate would be 25% per year yielding an additional 116 basis points of additional annual return (11.1%) on top of our base case forecast.
As prepayments rise above market expectations the total return prospects for non-agency bonds will vary by sector and on a bond-by-bond basis. Repeating the analysis above on selected bonds backed by 2005-2007 vintage non-agency collateral from the prime, option ARM and subprime sectors yields Figure 6 below.
Figure 6
Annualized Return Over Three Years
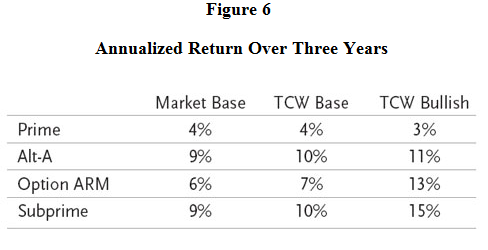
Source: TCW, Intex
In this analysis we have assumed that the percentages of borrowers with 12 months of clean payment history across prime (73%), Alt-A (65%), option ARM (48%) and subprime (37%) doesn’t change over time. However, we suspect that the more equity one has in the home the more inclined one is to make regular mortgage payments. We have also assumed that the tight mortgage credit conditions remain unchanged over the next three years. However, credit conditions are likely to become easier as home prices rise and equity is recaptured. Finally, as LTVs no longer become a roadblock for borrowers, rate incentive and “pent-up” turnover demand will become the driving forces of voluntary prepayments once again. While we acknowledge that rates are likely to continue to rise over time, there are certain loan characteristics such as ARM resets, interest-only (IO) resets and temporary modifications that will help preserve the rate incentive in a rising rate environment². Even though mortgage rates have risen recently borrowers still have an average of 110 bps of rate incentive. Overall, these dynamics will combine to unlock even more prepayment upside than the reduction in LTVs would imply. It is evident that as home prices recover, so will voluntary prepayments, resulting in higher than expected returns for most of the non-agency mortgage market.
1 As lower LTV loans prepaid, the surviving loans resulted in an actual 2013 distribution shown below in Figure 5 with a mean of 94%.
2 Borrowers with ARM loans will see their mortgage payments rise with rates. Interest-only borrowers that are still in the interest-only period will see their mortgage payments rise after the interest-only term is complete. 29% of outstanding legacy non-agency borrowers have had their mortgages modified to reduce the debt burden. Many of these reductions typically have a five-year term. As the modifications expire mortgage payments will rise.