One of the ongoing challenges that advisors face is determining what percentage of their clients assets should be allocated to international equities. The magnitude of this decision is often amplified when the United States has years of persistent out/under performance. US clients will inherently gauge the success of their portfolio based on the S&P 500, or similar index. Last year was one of the most challenging times for global investors, as the average country was up a mere 7% while the United States was up 32%. The challenge for advisors is explaining why a more diversified exposure to global equities is meaningful in the long-run, despite recent years of outlandish performance.
In this research we explore three key reasons that support a move towards international equities in the current market. For advisors that are looking to talk with their clients about the importance of capturing profits from their US equity exposure and diversifying to international markets, we think they can sum it up in one sentence:

The current market offers clients the opportunity to purchase higher quality investments that have been beat up over the last few years and are now being sold at a significant discount to the US.
As shown in the Exhibit 1 below, the US has outperformed International markets by a substantial margin since 1995. Based solely on this chart, investors may question the validity of international investing in general. Why would one want to invest in a region of the world that they don’t understand well, seemingly has higher risks, and has underperformed?
Exhibit 1 - Growth of $100: US vs. International Stocks – 1/1/95 to 12/31/13

Exhibit 2 - Returns of US vs. Average Country since 1995

In Exhibit 2, we can make several observations. First, the US outperformed the average country (not necessarily the capitalization-weighted index) by a wide margin from 1995-2000. Second, from 2000 to 2010, the average country was up over 180%, and the US was up less than 10%. Last, the US has outperformed the average country by over 40% for the last 4 years. For the timeframe in the 2000s, it is clear that International markets would have been the best choice.
Exhibit 3 - Annual Returns of Selected Regions: 2001-2013

In Exhibit 3 we show the returns of a variety of regional markets around the world. What is interesting in this chart is the lack of correlation from one period to the next. In fact, there is virtually no discernable pattern in the returns that will allow one to tactically allocate between regions based on the short-term (prior year or two) performance.
While US markets have certainly been the strongest in the past 4 years, we see a tendency for longer-term outperformance to be mean reverting. We don’t know exactly when the US outperformance will end, and it certainly could go longer than anyone expects, but the prudent investor will begin to consider International investments in the near-term.
Another area where International markets become more interesting investments is based on their current valuation. As seen in Exhibits 4 and 5 below, the trailing valuations of the US (based on Price/Cash Earnings and Price/Book) are at a significant premium to International, European and Emerging Markets.
Exhibit 4 - Price/Cash Earnings: US, Europe, Emerging and International Markets
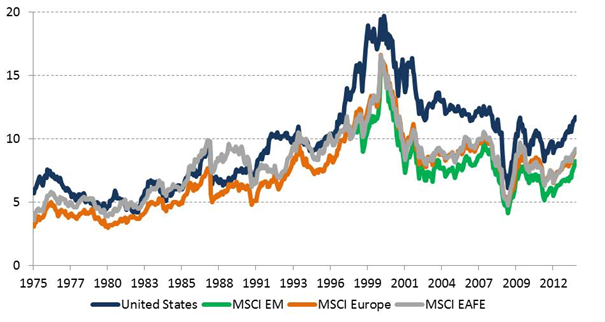
Exhibit 5 - Price/Book: US, Europe, Emerging and International Markets

Table 1 - Trailing Valuation Rations: Select European Countries

In Table 1, we see a more detailed breakdown of the Price/Earnings (P/E) and Price/Book (P/B) values of select European countries. What is interesting in this table is the degree to which valuations differ, even within the same geographic region. Russia, as an example, has a P/E of 5.2x, the cheapest in all of Europe. Spain trades at over 27x trailing earnings, versus a P/E of 17x for Europe. On a P/E basis, Russia would be interesting, and Spain would not. However, when looking at P/B, Spain trades at a discount vs. Europe (1.4x vs. 1.8x). The other point to be gleaned from this table is that even within a region that is cheaper than the US, there are countries that are undervalued, and countries that are overvalued. Investors that are buying Europe as a region based on its relative valuation will miss opportunities that can be uncovered through a more detailed analysis.
In addition to cheaper valuations, it turns out that International markets also have superior fundamentals. In Exhibit 6, we see the short-term earnings growth of the US vs. International markets.
Exhibit 6 - Short Term EPS Growth (%): US, Europe, International and Emerging Markets
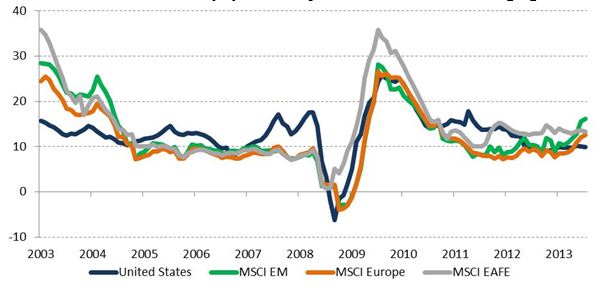
From a visual inspection of the exhibit, we see earnings in the US flattening out at about 10%. However, the International markets are all above those levels, and in the case of Europe and Emerging Markets, the earnings growth is accelerating. In Table 2, we show both the short-term and long-term growth statistics.
Table 2: Short and Long-term Earnings Growth

For those inclined to focus on long-term earnings growth, we see that the US is stronger than both Europe and Japan, and slightly higher than Emerging Markets. In that sense, the US still has strong fundamentals relative to the rest of the world. However, the trend in earnings growth towards higher level in International markets tilts the playing field away from the US in the near term.
Summary: Implications for Investors
Based on relative recent underperformance, cheaper valuations and superior fundamentals, International equity markets are attractive relative to the US market. It is unclear whether International outperformance will begin in the short run, or if the US will continue its outperformance for another year or two. Despite this uncertainty, we believe that now is the time for investors to begin to look at how International markets can help the risk/reward characteristics of their portfolios.
About Accuvest
This brochure is strictly informational and should be used for research use only. This brochure should not be construed as advertising material. The opinions expressed are not intended to provide investing or other advice or guidance with respect to the matters addressed in this brochure. All relevant facts, including individual circumstances, need to be considered by the reader to arrive at investment conclusions to comply with matters addressed in this brochure. Charts and information are sourced from Accuvest Global Advisors and the MSCI, unless otherwise noted. Remember that investing involves risks, as the value of your investment will fluctuate over time and you may gain or lose money. You should seek advice from your financial adviser before making investment decisions. Investment risks are borne solely by the investor and not by AGA. AGA is an independent investment advisor registered with the SEC. All disclosures, marketing brochures, and supplemental firm sheets are available upon request.