Price Pressure Becoming Pharmaceutical Industry's Bitter Pill as Breakthrough Drug Therapies Break the Bank
With spending on health care growing faster than the growth of the overall economy, the health care sector has been favored by investors. However, rising costs have been a double-edged sword as broad-based efforts to control spending gained political traction. Of particular concern have been drug costs, which are expected to increase 6.5% per year between 2015 and 2022, faster than the 5.8% expected increase in overall health care costs and much higher than the current 1.1% inflation rate.1 At what point do breakthrough drug therapies fail to justify their high cost, and who decides?
One of the results of the upward march in drug costs has been increasing restrictions on access. US-based formulary managers have been culling drugs from their formulary lists for years as part of an effort to control drug expenditures. For example, Pharmacy benefits manager CVS Caremark excluded 27 drugs from its formulary for 2014. Some of these included some highly anticipated new therapies. For example, a new treatment for Chronic Obstructive Pulmonary Disease (COPD), Breo Ellipta, was excluded in favor of current branded products, such as Advair and Symbicort. They did this despite the improved once-a-day dosing regimen that Breo Ellipta (the so-called 'son of Advair') allows. As the Chief Medical Officer of the country's largest drug benefit manager Express Scripts Steven Miller points out, drugs that make dosing easier may not justify a higher price assuming equally effective alternatives exist.
Reimbursement pressures add to the challenges the industry is facing. Gilead's recently launched hepatitis C drug is one example. The drug is effective, well tolerated, and its dosing is simple: one pill a day for 12 weeks. The problem for many formulary managers is that the price is set at $1,000 per pill, amounting to $84,000 for a course of treatment. The drug is a breakthrough in treating hepatitis C, yet there is significant resistance from payers. Quoting Dr. Sumit Dutta, Chief Medical Officer for Catamaran Corp., "We're seeing the shift, where payers are finally going to say, 'It's $84,000, and the other therapy is $50,000 – what am I getting?'"² Likewise, California's advisory panel on state drug coverage recognizes the impact economics has on coverage despite therapeutic advancements. It has called Gilead's drug a "low value" therapy in response to its steep price. Their report notes that, even if they confine treatment to those patients with liver damage, it would still cost the state a mammoth $6.3 billion. Expanding access to all hep-C patients is hardly possible without bankrupting the system.
National payers are also becoming increasingly price sensitive. For the first time ever, Australia is monitoring patient performance to see if a drug is worth its cost. With respect to their coverage of cancer drug Yervoy, the chair of the Pharmaceutical Benefits Advisory Committee Australia asked, "Do we get the survival benefit in the community that we saw in the trials?" Yervoy's high cost combined with an average incremental survival benefit of 3.9 months is causing payers to question the economic value of this $120,000 therapy. Many European countries already implement policies comparing cost with benefit. Germany's AMNOG law requires pharmaceutical firms to offer proof that new drugs deliver benefits over existing therapies. The UK's National Institute for Health and Clinical Excellence incorporates economic considerations before approving drugs for reimbursement by its government.
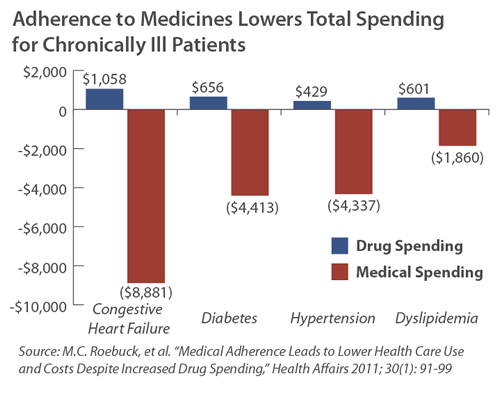
Paradoxically, drugs are key in helping to control overall health care spending. Consider that patients with the chronic conditions in the chart at right saved $3 to $10 in non-drug spending for each dollar spent on the drugs themselves. This results in savings of $1,200 to $7,800 per patient per year.
Another study looked at the impact on overall Medicare spending upon the introduction of the Part D drug program in 2007. The researchers found increased access to drug therapies produced an overall savings of $13.4 billion for the first full year of the program.³
Innovations contribute to better quality health care and better cost control. For example, the arrival of genetic testing allows for the identification of a preferred course of treatment for a variety of conditions. In cancer, mutations can have a huge impact on the success of a drug therapy and offer insights into what treatment to administer and how a patient might be expected to respond to a drug. That cancer treatments can run around $100,000 makes the cost and advancement of personalized medicine more cost effective despite the additional expense. Even Gilead's Sovaldi makes for a challenging ethical and economic argument: pay for a liver transplant or pay $84,000 for the drug therapy?
Unfortunately, innovation is costing us more and more as drug development has become increasingly difficult and more expensive. The Biopharmaceutical Research Industry points out that it takes 10 to 15 years to bring a drug to market and costs $1.2 billion in research and development.4 The amount quoted likely relates to a landmark 2000 study done by J.A. DiMasi. However, including the cost of drug failures pushes up the cost significantly. Looking at R&D spending relative to drug approvals provides a glimpse of the costs that drug companies must recoup:
| Company | Total R&D Spending 1997-2011 ($Mil) | Number of Drugs Approved | Avg. R&D Cost per Drug ($Mil) |
| AstraZeneca | 58,955 | 5 | 11,800 |
| GlaxoSmithKline | 81,708 | 10 | 8,200 |
| Sanofi | 63,274 | 8 | 7,900 |
| Roche | 85,841 | 11 | 7,800 |
| Pfizer | 108,178 | 14 | 7,700 |
| Johnson & Johnson | 88,285 | 15 | 5,900 |
| Eli Lilly | 50,347 | 11 | 4,600 |
| Abbott Laboratories | 35,970 | 8 | 4,500 |
| Merck | 67,360 | 16 | 4,200 |
| Bristol-Myers Squibb | 45,675 | 11 | 4,200 |
| Novartis | 83,646 | 21 | 4,000 |
| Amgen | 33,229 | 9 | 3,700 |
| Sources: InnoThink Center for Research in Biomedical Innovation; Thomson Reuters Fundamentals via FactSet Research Systems via Forbes.com article "The Truly Staggering Cost of Inventing New Drugs." | |||
The reality is that reimbursement pressures will continue to grow despite climbing research costs and therapeutic advancements. But what will be the impact on innovation? If drug companies reduce their prices amid climbing costs, does it hinder their enthusiasm for R&D spending? At the venture capital level, where many new products are born, will investors still be willing to put up money for a product that may take 10 years to come to market in an increasingly hostile pricing environment, or will they prefer to put their capital elsewhere?
Footnotes
¹ CMS' National Health Expenditure Projections 2012–2022.
² Armstrong, Drew. Gilead getting resistance from payers on pricey drug. SFGate.com. January 28, 2014. http://www.sfgate.com/business/article/Gilead-getting-resistance-from-payers-on-pricey-5183038.php
³ J.M. McWilliams, et al. "Implementation of Medicare Part D and Nondrug Medical Spending for Elderly Adults with Limited Prior Drug Coverage." JAMA 2011; 306(4): 402-409
4 2013 Profile, Biopharmaceutical Research Industry. Pharmaceutical Research and Manufacturers or America.
Copyright 2014 Saturna Capital Corporation and/or its affiliates. All rights reserved. Vol. 8 · No. 4
Saturna Capital publishes From The Yardarm Market Commentary & Analysis monthly.
Saturna Capital does not share subscriber information with third parties.
Important Disclaimers and Disclosures
This report is intended only for the information of the reader and is not to be used for or considered as an offer or the solicitation of an offer to sell or buy any securities or other financial instruments of any kind, including without limitation, any mutual fund or other product offered, sponsored, created, or managed by Saturna Capital Corporation or its subsidiaries or affiliates ("Saturna"). This report is not intended for distribution to, or use by, any person or entity who is a citizen or resident of, or located in, any locality, state, country, or other jurisdiction in which such distribution, publication, availability, or use would be contrary to law or regulation or which would subject Saturna to any registration or licensing requirement within such jurisdiction.
This document should not be considered as providing investment advice or services, or any other service offered by Saturna. Saturna may not have taken any steps to ensure that the securities referred to in this report are suitable for any particular investor. Saturna will not treat recipients as its customers by virtue of their reading or receiving the report.
Nothing in this report constitutes investment, legal, accounting, or tax advice or a representation that any investment or strategy is suitable or appropriate to a particular investor's circumstances or otherwise constitutes a personal recommendation to any investor. Saturna does not offer advice on the tax consequences of any investment.
All material presented in this report, unless specifically indicated otherwise, is under copyright to Saturna. None of the material, nor its content, nor any copy of it, may be altered in any way, transmitted to, copied, or distributed to any other party without the prior express written permission of Saturna. Unless otherwise indicated, all trademarks, service marks, and logos used in this report are trademarks or service marks of Saturna.
The information in this report was obtained from sources Saturna believes to be reliable, and Saturna believes the information and opinions in the material are accurate and complete as of the date of this material. However, information and opinions contained herein will change over time and without notice. Saturna has no obligation to update or amend any information or opinions at any time. Saturna makes no representations as to the accuracy or completeness of this material, nor does it have any responsibility to ensure that any other materials, including any containing materially different information, are brought to the attention of any recipient of this report.
Under no circumstances shall Saturna, its employees, or any affiliate be responsible for any investment decision by any recipient. This material is distributed on condition that it will not form the sole basis or a sufficient basis for any investment decision by any recipient. Any recipient who is not a market professional or institutional investor should seek the advice of an independent financial adviser prior to making any investment based on this report or for any necessary explanation of its contents.
Saturna does not provide tax, legal, or accounting advice. Investors should consult their own tax, legal, and accounting advisers before engaging in any transaction. In compliance with IRS requirements, recipients are notified that any discussion of US federal tax issues contained or referred to herein is not intended or written to be used for the purpose of (A) avoiding penalties that may be imposed under the Internal Revenue Code; nor (B) promoting, marketing, or recommending to another party any transaction or matter discussed herein.
The Dow Jones Industrial Average is a price-weighted index of 30 of the largest, most widely held US stocks. The S&P 500 is an index comprised of 500 widely held common stocks considered to be representative of the US stock market in general. The Russell 1000 Growth index is a widely recognized index of large-cap growth stocks. The Russell 2000 Index is comprised of US small cap stocks and measures the performance of the 2,000 smallest US companies in the Russell 3000 Index. The NASDAQ Composite index measures the performance of more than 5,000 US and non-US companies traded "over the counter" through the National Association of Securities Dealers Automated Quotation system. The MSCI EAFE Index, produced by Morgan Stanley Capital International, measures the equity market performance of developed markets in Europe, Australasia, and the Far East. The MSCI Emerging Markets Index, produced by Morgan Stanley Capital International, measures equity market performance in over 20 emerging market countries. Barclay's Capital US Aggregate Bond Index measures the performance of the US bond market. All indices shown are widely recognized unmanaged indices of common stock prices that reflect no deductions for fees, expenses, or taxes. Investors cannot invest directly in the indices.
Past performance does not imply or guarantee future performance, and no representation or warranty, express or implied, is made regarding future performance. The price for, value of, and income from any of the securities or financial instruments mentioned in this report can fall as well as rise. The value of foreign securities and financial instruments is subject to exchange rate fluctuations that may have a positive or negative effect on the price or income of such securities or financial instruments. Investors in securities such as American Depositary Receipts — the values of which are influenced by currency volatility — effectively assume this risk.
Please consider an investment's objectives, risks, charges, and expenses carefully before investing. To obtain this and other important information about the Amana, Sextant and Idaho funds in a current prospectus or summary prospectus, please visit www.saturna.com or call toll free 1-800/SATURNA. Please read the prospectus or summary prospectus carefully before investing.
The Amana, Sextant and Idaho Tax-Exempt Funds are distributed by Saturna Brokerage Services, member FINRA /SIPC. Saturna Brokerage Services is a wholly-owned subsidiary of Saturna Capital Corporation, adviser to the Amana, Sextant and Idaho Tax-Exempt Funds.