The celebration of the DJIA’s new record high on April 30th was notable for its absence. Small Cap stocks, in fact, commemorated the event by falling to an 11-month relative strength low, and many technicians point to this divergence as evidence that a dangerous period of “distribution” is now underway. We’re not so sure.
Chart 1
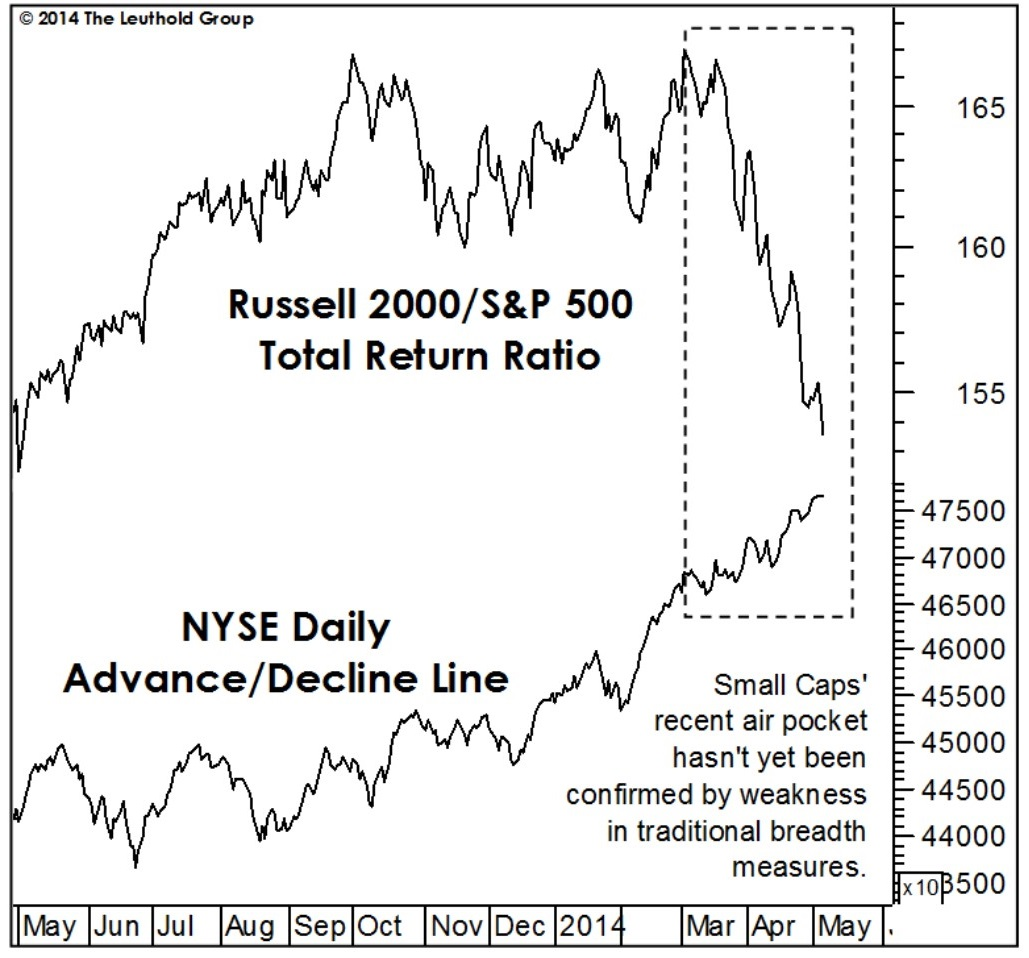
Weakness in market breadth almost always entails Small Cap underperformance, but the reverse is not always true: Small Caps can underperform without an accompanying deterioration in stock market breadth—and that’s exactly what has occurred recently. Chart 1 shows the surprising action of the NYSE Daily Advance/Decline Line during Small Caps’ recent two month relative strength break; the breadth trend has been steadily up.
The final distribution phase before a market top is typically accompanied by erosion in not only Small and Mid Cap market breadth, but in Large Cap breadth as well. We frequently point to the market top of 2007 as a textbook example of a market top from a technical perspective (Chart 2). Even an analyst focused solely on the S&P 500 would have recognized something was amiss by mid-2007; the S&P 500 Advance/Decline Line topped out four months before the index itself, and the Equal-Weighted S&P peaked even earlier in 2007.
Charts 2 and 3

Fast forward to 2014 (that is, unless you’d like to reminisce for a moment over 2008). The S&P 500 Advance/Decline Line stood at a bull market high in early May, while the Equal-Weighted S&P has suffered only a minor relative strength setback in the last month. We think it’s a stretch to label this action “internal market weakness.” We’ll need to see more evidence.
To amplify our view that Small Cap underperformance doesn’t imply an imminent stock market top, we present the accompanying review of Small Cap action during the last five bull markets (Chart 4). In four of the five cases, the Russell 2000 made its relative strength peak versus the S&P 500more than a year before the S&P 500 itself topped out. In two cases (1983-87 and 1994-1998) the bull market lasted another four years.
The March 2000 episode was an exceptional case in which the Small Cap relative strength peak did warn of an imminent bear market. The Russell 2000 topped out on a relative basis on March 7, 2000, and proceeded to underperform the S&P 500 by 17 percentage points in 17 days leading into the historic S&P 500 high of March 24, 2000 (which is still the highest S&P 500 level ever reached on an inflation-adjusted basis).
Chart 4
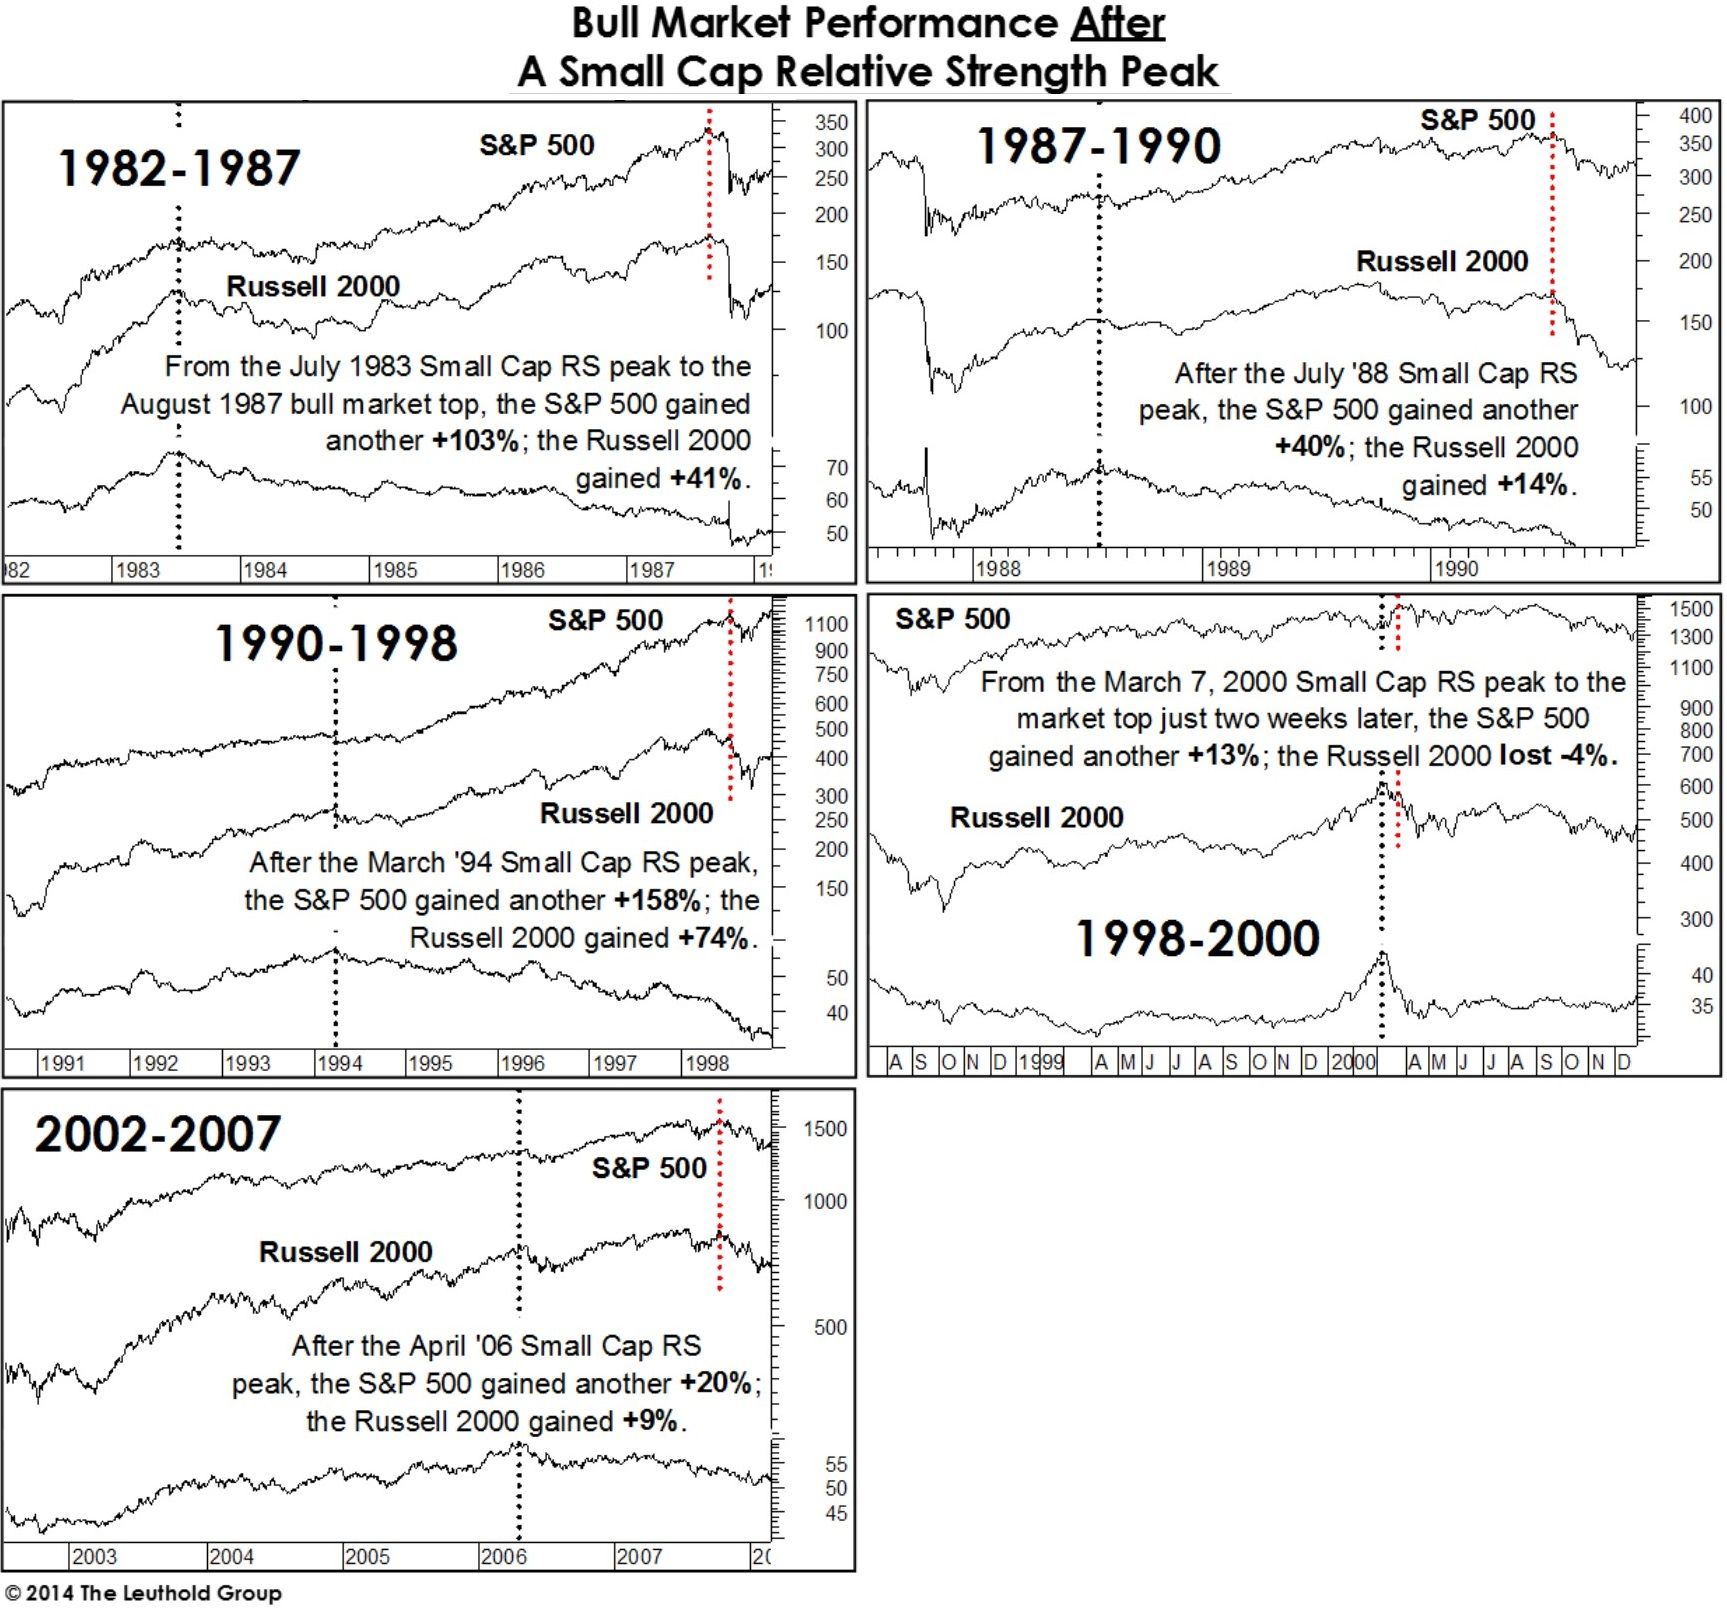
Results across the five cycles are so disparate that it’s misleading to speak in terms of average or median additional bull market gains one might expect assuming the early March relative strength peak in Small Caps* holds. Additional bull market gains in the S&P 500 after Small Cap RS peaks have recently ranged from +13% (in 2000) to 158% (1994-1998). Even the Russell 2000, while never revisiting its bull market relative strength high, generated additional gains in all but the 2000 instance.
We don’t want to leave the impression that the end of the current bull market may still be years away. We just want to dispel the common belief that Small Cap underperformance and breadth deterioration are one and the same. They aren’t. The recent RS peak in Small Caps could be the beginning of a broader topping process. But if so, traditional market breadth measures will track this process more accurately than any cap-weighted measure, including the Russell.
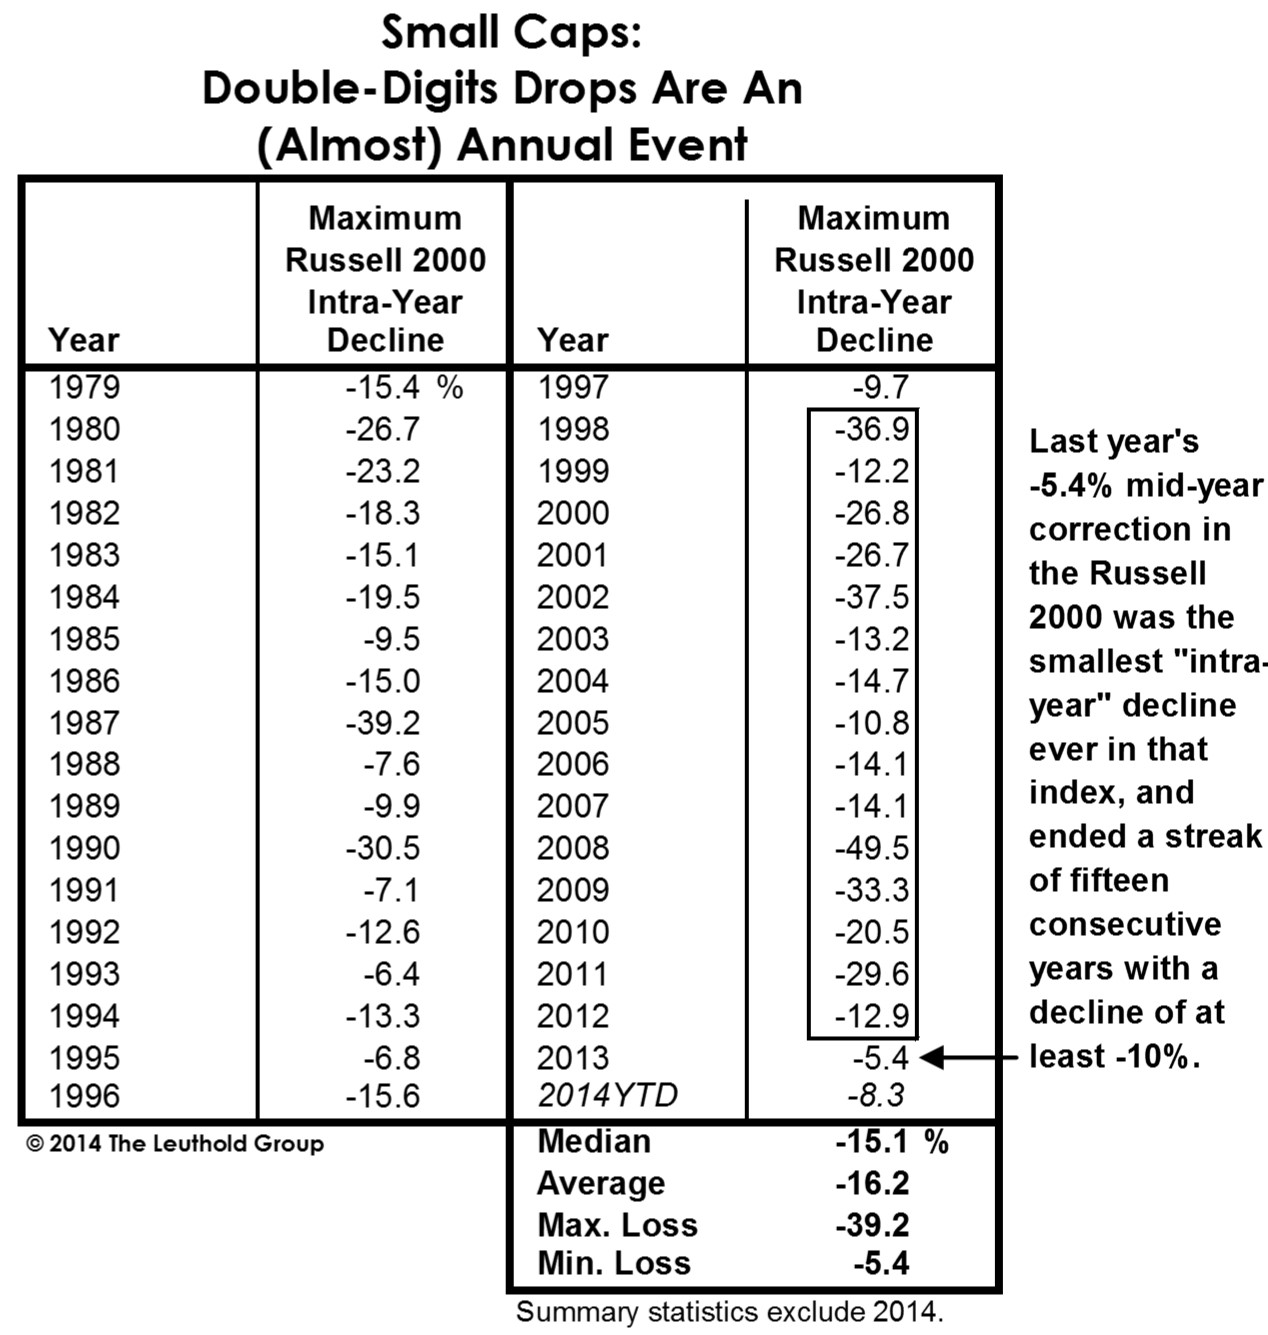
Finally, it’s easy to forget Small Caps’ inherent volatility during the latter innings of a cyclical bull market—and especially following a year in which the Russell 2000 experienced its smallest-ever “intra-year” correction (-5.4%). Last year’s performance, in fact, broke a 15-year streak in which the index had suffered a double-digit decline every year (Table 1). In the 35-year history of the Russell 2000, 28 have seen an intra-year double-digit drawdown. The median such decline in this index has been -15.0%, compared with a median intra-year decline in the S&P 500 of -10.3% over the same time period. If the S&P suffers a 10-12% setback later in 2014, the Russell 2000 decline could easily top 20% based simply on the higher beta of the latter index (and Small Caps’ large valuation premium certainly doesn’t help their cause).
Table 1
*Technical note: The timing of the Russell 2000 relative strength peak in this bull market is open to two interpretations. On a total return basis, the Russell 2000 peaked on April 6, 2011, and we have generally considered the last three years’ action to be the tentative first leg of a new Large Cap leadership cycle. But on a price-only basis, the Russell 2000 barely edged out its April 2011 high in the first few days of March 2014.
© 2014 The Leuthold Group