Schroders Multi-Asset Insights: What is the forward curve telling us about US Treasury yields?
US 10-year Treasury bonds have generated positive performance of +3.5% in the first four months of this year with this fall in Treasury yields taking many investors by surprise. Lower US growth in the first quarter, and lower-than-expected inflation numbers, have caused bond investors to reassess the value of long-term bonds. Most bond investors have remained underweight interest rate risk and are asking themselves how much further Treasury yields can drop from here.
The forward curve can give us some indication of future spot market moves. The UST 10-year yield in forward space (defined as the 5-year forward yield minus the 1-year forward yield in Figure 1 below) started to price in the consequences of quantitative easing (QE) tapering only when the US Federal Reserve (Fed) took action in December last year. This resulted in a flattening of the forward curve as the Fed was perceived to be slightly ahead of the game. The UST 10-year spot yield did not react until the beginning of January to this downward pressure, as the market’s optimistic growth and inflation forecasts kept short-term rates higher. This divergence between longer-term forward spreads and the UST 10-year spot rate did not last very long and yields quickly adjusted downwards. The current forward curve spread has continued to fall over the past two weeks (despite the growth rebound in the US after the harsh winter), which would suggest a lower UST 10-year yield over the coming weeks.
Figure 1: UST 10-year yield spot versus forward spread (5-year minus 1-year forward spread)
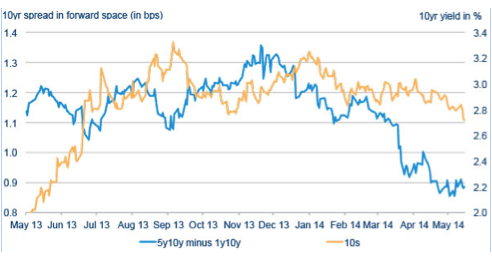
Source: Schroders, Bloomberg, May 2014
European inflation update
Despite recent signs of a modest recovery in European growth, inflation in the region continues to stay at stubbornly low levels. The last few months have seen inflation below 1% and concerns over the momentum in growth have recently sparked renewed concern over the risk of deflation faced by Europe. This low inflation was partly due to increased deflationary pressures from food and energy prices, but also lower import prices resulting from the strength of the euro. While deflation in the Eurozone is not our central view, as we see economic recovery continuing, we do recognize that the risk is rising.
As a result, speculation concerning possible QE, or similar large-scale asset purchase programs from the European Central Bank (ECB), has received a fair amount of attention lately. If the ECB decides to act, real yields in the Eurozone could, all other things being equal, fall further than nominal yields as the market focuses on the ECB’s ability to raise inflation expectations. Previous programs of monetary stimulus that have been undertaken in the US and UK have highlighted that, from a timing perspective, the rise in inflation expectations has generally taken place only after the actual QE implementation (as illustrated in Figure 2). If history holds true, the implication of this from a portfolio management perspective would be to wait for the QE intervention to start before switching part of any nominal exposure into linkers in order to take advantage of this opportunity.
Figure 2: Change of inflation expectation (1-year ahead inflation forecast on the Philadelphia Fed Survey of Professional Forecasters)
Average change of inflation expectation before and during QE’s in US
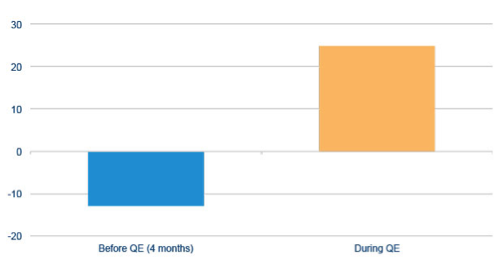
Source: Schroders, Bloomberg. November 2008 to March 2013
Why is volatility so low?
With the Fed continuing to taper QE and with forward guidance becoming less explicit as targets are hit, it might be natural to expect to see volatility rise. However, we are currently seeing volatility decrease, not only in equities, but across asset classes with volatility hitting multi-year lows (see Figure 3).
Figure 3: Market volatility
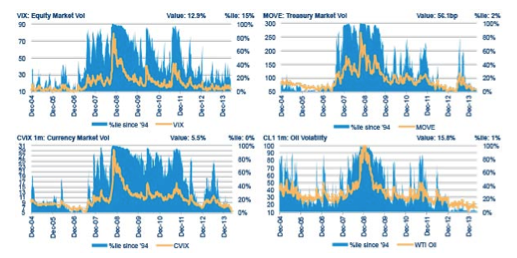
Source: Schroders, Bloomberg 9 May 2014
However; we do not believe that this current low volatility environment indicates that market participants are being complacent. For example, despite the low level of volatility, the cost of holding equity volatility (represented as the cost of rolling down the VIX futures curve from the 2nd to the 1st contract) as protection is 10% per month, which is well above the average of approximately 5.5% (Figure 4).
Figure 4: Cost of holding a long position in the 2nd VIX futures contract
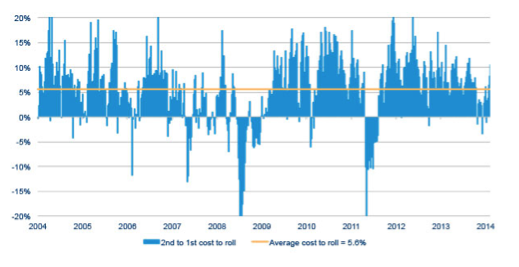
Source: Bloomberg, Schroders calculations at 19.05.14
The outstanding open interest (OI) in Dec 14 puts on the S&P 500 provides further evidence that the complacency we witnessed earlier in the year has dissipated. Puts which are 5-10% out the money (OTM) have nearly doubled as a proportion of outstanding OI at year end from 6% to around 13% at present. Further, we have seen S&P 500 3m 90-110% skew increase from very low levels to around average now, implying a greater demand for downside protection vs. upside exposure than markets had been pricing earlier in the year. Finally, the volatility risk premium on the S&P 500 (1m implied at the money volatility minus 1m realized volatility) is once again positive, implying that market participants are prepared to pay more for volatility than the market is actually delivering. Taking these points together, we would argue that market participants are using the low volatility environment to add protection to their portfolios.
This phenomenon of persistently low volatility is usually explained by the Central Bank’s response to the financial crisis and the ‘put’ option that has been in place on risky assets. This has helped to prop up global growth and markets and has, therefore, dampened volatility. Furthermore, the introduction of forward guidance has served to reduce uncertainty over the future path of interest rates, which has also served to reduce volatility. Some of the continued reduction in cross asset volatility could be in response to/anticipation of other central bank QE programs (Bank of Japan, ECB). Another source of this low volatility is that global growth is currently looking much better: the US growth picture looks healthy; the Eurozone is finally out of recession (in particular the periphery is rebounding); and here at home the UK is currently the fastest growing developed market in the world. All are likely to be contributing to the low levels of volatility we are currently witnessing.
We can assess the risk environment by analyzing a number of fundamental indicators . These are currently showing little sign of stress across the range of indicators we monitor. The two main points of stress we do pick up from this work come from volatility in economic activity indicators (see Figure 5), and from the Chinese money market.
Figure 5: VIX vs. volatility of PMI data
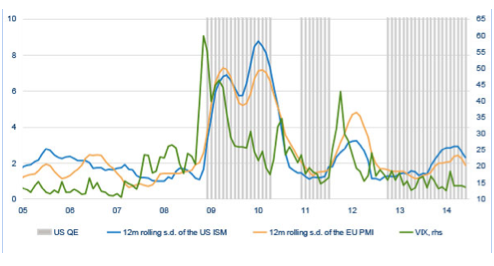
Source: Schroders, Bloomberg
Two potential causes of a future spike in volatility are disappointment over future growth, since expectations are already high, and the potential for stress from emerging markets/China. We had identified these in our volatility outlook paper earlier this year and we believe they remain critical to monitor.
Important Information: For professional investors and advisers only. This document is not suitable for retail clients. These are the views of Aymeric Forest, Matthew Joyce, Matthias Scheiber and the Schroders’ Multi-Asset Group, and may not necessarily represent views expressed or reflected in other Schroders communications, strategies or funds. This document is intended to be for information purposes only and it is not intended as promotional material in any respect. The material is not intended as an offer or solicitation for the purchase or sale of any financial instrument. The material is not intended to provide, and should not be relied on for, accounting, legal or tax advice, or investment recommendations. Information herein is believed to be reliable but Schroder Investment Management Ltd (Schroders) does not warrant its completeness or accuracy. No responsibility can be accepted for errors of fact or opinion. This does not exclude or restrict any duty or liability that Schroders has to its customers under the Financial Services and Markets Act 2000 (as amended from time to time) or any other regulatory system. Schroders has expressed its own views and opinions in this document and these may change. Reliance should not be placed on the views and information in the document when taking individual investment and/or strategic decisions. Issued by Schroder Investment Management Limited, 31 Gresham Street, London EC2V 7QA, which is authorized and regulated by the Financial Conduct Authority. For your security, communications may be taped or monitored. 940834