Interpreting the bond rally from a multi-asset perspective
If there’s one thing investors agreed upon at the beginning of this year, it was that bond yields were heading higher. A rising rate environment was practically a foregone conclusion as the world moved to the end of an extraordinary period of central bank policy accommodation. The bond market, though, has not obliged this expectation, as rates have moved sharply lower and have reached new year-to-date lows (for example, the 10 year U.S. Treasury). Over the past few weeks, I have read any number of research reports attempting to understand the reasons for this unexpected rally. Several plausible explanations have been offered, including the growing probability of a policy rate cut by the European Central Bank (ECB).
This article takes a different approach, first by evaluating the bond rally in the context of cross asset performance, and second by focusing on the implications going forward of the change in interest rate landscape so far this year. Regardless of why yields have collapsed recently, the portfolio strategy implications of today’s low yield levels going forward are profound.
Let’s start with the observation that the year-to-date rally in bonds can be attributed to two distinct moves during the year separated by a period of sideways rate movements (Exhibit 1). To be precise, the first move lower in yields occurred from the beginning of the year through February 3. The second arguably began on April 17 and is ongoing as of this writing.
Exhibit 1

Source: Bloomberg. Data from 01/01/14 to 05/28/14
From a cross asset class perspective, these two distinct rally phases differ substantially. Exhibit 2 summarizes the changes in key variables during both phases. The contrast is striking. During the early year rally, patterns seemed compatible with fear of an economic slowdown. In addition to falling bond yields, we saw falling stock prices, elevated equity volatility and a distinct decline in economic data surprises. During the more recent rally phase, we have seen precisely the opposite conditions. In fact, with bond yields having broken through to new lows (as of May 28), we observe that stock prices remain at record high levels, credit spreads are as tight as they have been all cycle and volatility across stock, bond and currency markets is notably subdued.
Exhibit 2
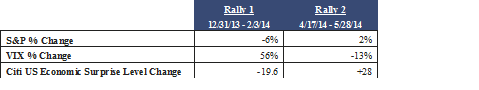
Source: Bloomberg. Data as of 05/28/14
There is another difference that matters. Since bond yields ended 2013 at their highest level in years, the initial move lower in 2014 was not sufficient to significantly change the valuation profile of bonds. The most recent rally, however, has left bonds in a much less desirable valuation position. Indeed, by an important measure that we utilize within the Global Asset Allocation team, interest rate levels today have become very unattractive.
Last month we introduced a framework for identifying capital market states based upon the interaction of bond market conditions and stock market conditions. We find this framework to be very helpful in establishing expectations for markets in the aftermath of the recent bond rally precisely because the most recent bond rally leaves rates at unattractive levels.
Exhibit 3
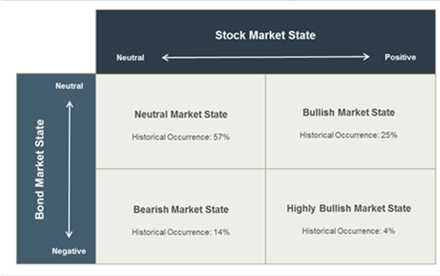
We can focus on the bottom two quadrants for the time being, since bond yields have breached our threshold for negative bond market state. This determination is primarily valuation based, so the level of rates matters, and the level of rates today, of course, is very low.
The stock market state is determined differently. Our mapping of the stock market state is driven by a number of market based indicators, but informally speaking, the fact that equities are moving higher and setting new record highs is evidence that the stock market state is positive. More formally, we conclude that the global equity market currently satisfies our conditions for positive market state. For the moment, then, our framework suggests a highly bullish market state overall. Should these positive conditions give way and move back to a more neutral condition, then the market state in our framework would shift to bearish.
Moving forward, this distinction will be crucial. The chart below extends the concept of our framework by presenting the historical evidence of asset class performance (as measured by Sharpe ratio) observed within each state. As you can see, the Sharpe ratio for each broad asset class is decidedly different across the four market states, most notably between the bearish and highly bullish market state. This suggests that the appropriate policy portfolio for each market state should be calibrated accordingly and thus identifying the prevailing market conditions is so important from a policy response. Furthermore, it should be clear from these differences that the most recent bond rally has brought us to a crucial fork in the road, facing two very different paths forward.
Exhibit 4

Strategists have been asking which market is right, the stock market or the bond market? This is exactly the right question, according to our framework. With rates as low as they are, ongoing strength in risk assets would typically motivate a reallocation from overvalued bonds to high performing stocks. This scenario, which is precisely the scenario that transpired for much of 2013, would be compatible in our view with an expanding and improving economy.
On the other hand, if risk assets begin to break down, the implication is that deeper issues are at work in the economy, and that capital preservation would become a primary objective for investment portfolios.
For now, we are willing to give the optimistic interpretation the benefit of the doubt, consistent with our indicator work. Accordingly, we expect to see ongoing strength in equities, which eventually should pressure bond markets and drive yields higher. Indeed, our portfolio strategy today is positioned accordingly.
In the weeks and months ahead, the durability of strong performance in risk asset markets will be key. For if bond yields fail to move higher, and risk assets begin to lose momentum, the market environment could become very challenging.
Disclosure
The views expressed are as of 6/2/14, may change as market or other conditions change, and may differ from views expressed by other Columbia Management Investment Advisers, LLC (CMIA) associates or affiliates. Actual investments or investment decisions made by CMIA and its affiliates, whether for its own account or on behalf of clients, will not necessarily reflect the views expressed. This information is not intended to provide investment advice and does not account for individual investor circumstances. Investment decisions should always be made based on an investor's specific financial needs, objectives, goals, time horizon, and risk tolerance. Asset classes described may not be suitable for all investors. Past performance does not guarantee future results and no forecast should be considered a guarantee either. Since economic and market conditions change frequently, there can be no assurance that the trends described here will continue or that the forecasts are accurate.
This material may contain certain statements that may be deemed forward-looking. Please note that any such statements are not guarantees of any future performance and actual results or developments may differ materially from those discussed. There is no guarantee that investment objectives will be achieved or that any particular investment will be profitable.
The Chicago Board Options Exchange OEX Volatility (VIX) Index reflects a market estimate of future volatility, based on the weighted average of the implied volatilities of 8 OEX calls & puts – the nearest in & out of the money call & put options from the 1st and 2nd month expirations.
The Sharpe ratio is calculated by subtracting the risk-free rate - such as that of the 10-year U.S. Treasury bond - from the rate of return for a portfolio and dividing the result by the standard deviation of the portfolio returns.
The Standard & Poor's (S&P) 500 Index tracks the performance of 500 widely held, large-capitalization U.S. stocks.
It is not possible to invest directly in an index.
Investment products are not federally or FDIC-insured, are not deposits or obligations of, or guaranteed by any financial institution, and involve investment risks including possible loss of principal and fluctuation in value.
Securities products offered through Columbia Management Investment Distributors, Inc., member FINRA. Advisory services provided by Columbia Management Investment Advisers, LLC.
© 2014 Columbia Management Investment Distributors, Inc. All rights reserved.
938357


