In the wake of the 2008-09 financial crisis, banks were hated. They were blamed for the chaos, and their very existence was uncertain. Liquidity ruled the day; tangible book value was the basis for valuation. Credit quality concerns with related write-offs dominated news, and net interest margins (NIM) plunged as loan demand dried up and interest rates plummeted.
Much has changed since then, and we have a different view of banks today. Their lagging performance over the past few years makes them less expensive than the rest of the market. Furthermore, we see an improved outlook for earnings and believe valuation metrics deserve to revert to more traditional methods. As that happens, there is potential for multiple expansion.
This chart compares bank stocks against the S&P 500 Index. Note how banks’ prices relative to the index as a whole fell precipitously leading up to and after the 2008-09 correction—and have essentially only marked time since then.

Net Interest Margins Likely to Improve
There is good reason for this: banks have been unable to grow NIM – the difference between what banks pay for their deposit base and what they are able to charge for loans – to pre-crash levels. This spread has been forced to historically low levels as interest rates have been driven down by the Federal Reserve and loan demand remained weak.
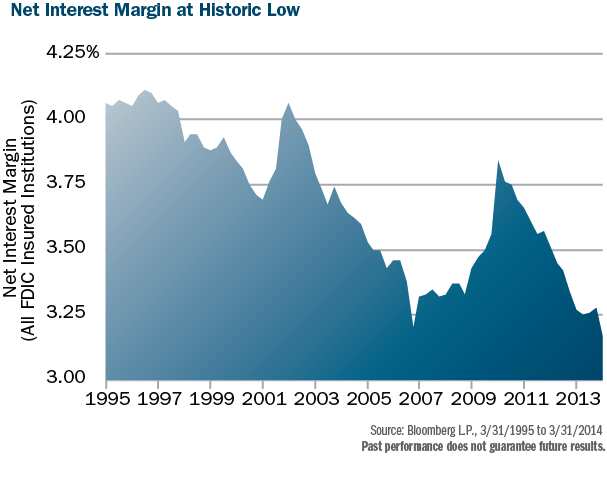
The decline in interest rates has also impacted banks’ cost of deposits, as even longer-dated CDs have rolled over to lower rates. Because loans tend to re-price more quickly than deposits, we expect banks’ NIM to expand as rates rise.
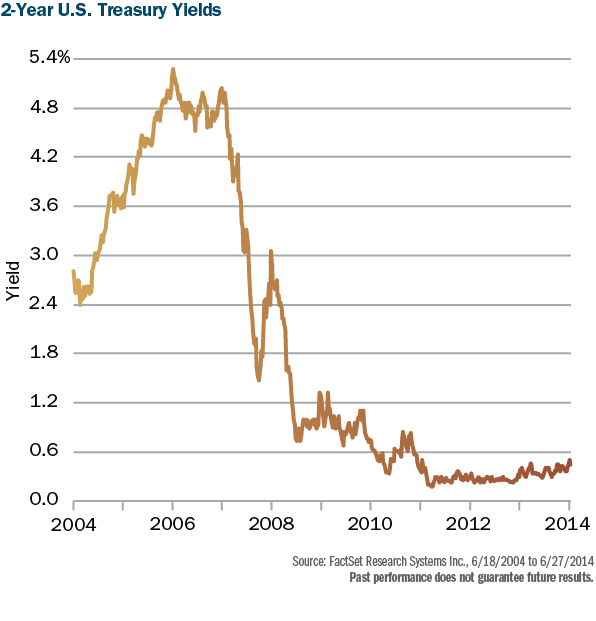
And we do believe that rates will rise. This next chart shows U.S. Treasuries over the past 10 years. Given the Fed’s aggressive balance sheet expansion, business activity cycles, and consumer activity pick-up, it seems inevitable that rates will rise. We think this chart depicts a long basing pattern, with recent activity that appears to indicate rates could be on the cusp of breaking out.
Until rates rise, many banks have the opportunity to grow NIM through a shift of assets on their balance sheets. In the absence of loan demand, banks invest deposits in short-term government securities. Any uptick in loan demand, even at today’s rates, allows banks to shift their earning assets from low-paying securities to higher-paying loans.
Historically Low Loans-to-Deposits Ratios
Additionally, banks are also fully funded: loans-to-deposits ratios are low versus levels of the last several decades, indicating that banks have plenty of capacity to lend. This makes banks attractively priced, in our view, on the basis of forward price-to-earnings assuming a restoration of only normal returns on assets.

For example, Capital City Bank Group Inc. (CCBG) is a bank holding company that exemplifies this opportunity. At the end of the first quarter of this year, CCBG had a loan to deposit ratio of 66.7% – significantly lower than its pre-financial crisis level of 89.3%. If CCBG can restore its loan ratio to this prior level, that change would equate to an incremental $477 million of loans and, with that expansion, higher earnings.
Investment Selection
We find banks in the $1 to $25 billion asset range particularly attractive, as they are free from some of the more draconian regulatory capital requirements, and have some flexibility with how they can leverage their capital. They are often leaders in their markets, and can be the consolidators of choice into areas that are natural extensions. While a great deal of consolidation has taken place, much more could, particularly with smaller banks struggling to deal with new regulatory oversight.
Associated Banc-Corp (ASBC), at $25 billion in assets, is a more likely buyer than seller as a leading regional bank predominantly in the central states. ASBC is levered to a manufacturing renaissance in the Midwest and already seeing strong commercial and business lending growth, with 13% annualized growth in the first quarter of 2014. ASBC also exemplifies cost rationalization, having consolidated or sold 28% of their branches since 2007 with the goal of achieving an efficiency ratio in line with its peers. The bank is trading at only 1.0x book value, a significant discount compared to a 20-year average of 1.7x. We see potential for multiple expansion as ASBC continues to deploy excess capital into organic growth, possible accretive acquisitions, stock buybacks, and dividend increases.
Successful banks are likely to be generating a lot of internal capital, and the strong banks will have choices about what to do with it. They’re clearly going to use it to fund loan growth and will likely buy back stock. It could also be used to grow dividends, which are an important part of banks historical value to investors. If we’re right in our outlook, banks have very attractive dividend-growth dynamics; this additional catalyst may not be widely understood by the market today.
Through the crisis, investors were concerned with liquidity and the fundamental question of banks survival. The predominant metric became price-to-tangible book value, and banks received no consideration for their intangibles. As investors grow in their confidence about banks’ outlook, we believe it is likely that franchises will be recognized for intangibles and other variables. A more traditional method of valuation, price-to-book, considers these additional variables, and enables margin expansion from current levels.
Conclusion
In summary, several broad trends provide support for our constructive view on banks, including potential NIM improvements, loan expansions, and consolidation that’s likely to continue. In our view, there’s a clear case for earnings growth, with the related potential for dividend growth.
Banks are reasonably valued today based on both earnings and book value, and investors may assign higher multiples as their confidence in banks’ outlook improves.
It’s important to consider broad investment themes like these in combination with company-specific research, such as the analysis we perform using Heartland’s 10 Principles of Value Investing™. Both types of information are needed to evaluate potential catalysts for wider recognition of companies’ inherent value.
Disclosure:
Past performance does not guarantee future results.
Investing involves risk, including the potential loss of principal. There is no guarantee that any particular investment strategy will be successful.
The statements and opinions expressed in this article are those of the author. Any discussion of investments and investment strategies represents the portfolio manager’s views when presented, and are subject to change without notice. Security valuations are based on Heartland Advisors’ estimates. Any forecasts may not prove to be true.
Economic predictions are based on estimates and are subject to change.
As of 6/30/2014, Advisors on behalf of its clients held approximately 0.00%, 1.40%, and 2.42% of the total shares outstanding of SPDR S&P Regional Banking ETF, Capital City Bank Group Inc., and Associated Banc-Corp, respectively. Statements regarding securities are not recommendations to buy or sell. Portfolio holdings are subject to change. Current and future holdings are subject to risk.
Data Sourced from FactSet: Copyright 2014 Factset Research Systems Inc, FactSet Fundamentals. All rights reserved.
Definitions: Book Value: is the sum of all of a company’s assets, minus its liabilities. Net Interest Margin: is a performance metric that examines how successful a firm’s investment decisions are compared to its debt situations. A negative value denotes that the firm did not make an optimal decision, because interest expenses were greater than the amount of returns generated by investments. Price/Book Ratio: of a company is calculated by dividing the market price of its stock by the company’s per-share book value. Price/Earnings Ratio: of a stock is calculated by dividing the current price of the stock by its trailing or its forward 12 months’ earnings per share. Price/Tangible Book Ratio: of a company is calculated by dividing the market price of its stock by the company’s per-share tangible book value. Price/Tangible Book Ratio: of a company is calculated by dividing the market price of its stock by the company’s per-share tangible book value. SPDR S&P Regional Banking ETF: is an exchange traded fund incorporated in the USA with an objective to replicate as closely as possible the performance of the S&P Regional Banks Select Industry Index, an equal- weighted index. S&P 500 Index: is an index of 500 U.S. stocks chosen for market size, liquidity and industry group representation and is a widely used U.S. equity benchmark. All indices are unmanaged. It is not possible to invest directly in an index.
CFA is a trademark owned by the CFA Institute.
2014475
©2014 Heartland Advisors


