What is Correlation?
Correlation is a statistical term that helps describe the relationship between two investments, enabling an investor to determine how similar two investments are to each other. By understanding the correlation between the investments in a portfolio, an investor can understand how likely it is, for example, for two or more of those investments to gain or lose money at the same time. Or, to put it another way, the investor can understand how well an investment portfolio’s diversification is reducing the risk of loss.
Correlation is measured by the correlation coefficient, which is quantified as a value between 1 and -1. A value of 1 indicates perfect positive correlation. If two investments had a correlation of 1, it would indicate to an investor that the two investments are likely to behave exactly alike.
You can conclude from this that a portfolio of investments with correlation coefficients close to 1 (i.e. .70 / .75 / .80 / .86 / .90 / etc.) will all tend to move up or down at the same time. A portfolio of investments like this is, as the old saying goes, “putting all your eggs in one basket.” Investing like this would be considered poor diversification because if one investment loses money, it is likely that every investment in the portfolio would lose money at the same time.
A correlation coefficient of -1 indicates perfect negative correlation. Two investments that had a correlation of -1 would indicate that the two investments are likely to behave exactly opposite to each other. That is, if one of the investments went up 50%, the other would likely go down 50%.
Finally, a correlation of zero would indicate two investments that have no correlation. These two investments act randomly with respect to one another, which is to say, if one of the investments went up or down, this would give us no indication as to what the other investment would do.
To reduce the risk of loss through diversification, or to put it another way, if you don’t want all your eggs in one basket, it is necessary to identify investments with low or even negative correlation to each other. The lower the correlation between two investments, the more risk of loss is reduced in an environment that causes one of the investments to go down in value.
The danger of “correlation convergence”
Consider the following example: The traditional equity asset classes that most investors recognize as the norm for allocating equity portfolios are the following:
· Large-capitalization (cap) growth stocks
· Large-cap value stocks
· Mid-cap growth stocks
· Mid-cap value stocks
· Small-cap growth stocks
· Small-cap value stocks
Over the past few years, these equity asset classes have become highly correlated (see Figure 1 below). When the correlation coefficients among asset classes within investment portfolios begin to converge on 1, we lose the value of diversification for reducing risk (losses) within those portfolios.
In addition, research shows that in down markets, when you really need diversification to help protect you from losses, these asset classes become even more highly correlated. Various explanations have been given for the increased convergence of correlation coefficients, including a herd mentality (especially in down markets) that has been documented.[i] However, it’s not as important to understand why this is happening as it is to acknowledge that this phenomenon exists and it can have a detrimental effect on your portfolio.
Discussion of the sources of correlation convergence among equity asset classes will continue. Yet, one thing is certain—with all other variables held constant, allocating your investments among asset classes with low correlation to each other will reduce the risk of loss to a greater extent than allocating among asset classes that are more highly correlated to each other.
It is clear that the equity asset classes in Figure 1 below have become too similar to each other to reduce risk. Diversifying an investment portfolio among these equity asset classes would be like a New York City street vendor who sells only umbrellas. To diversify, he decides to add raincoats as well. Yes, he has diversified, but he hasn’t reduced his risk of losing money when the sun is shining. Just as the New York City street vendor would be much better off with umbrellas and sunglasses, an investor should diversify his or her asset mix in such a way that the asset classes he/she uses are not too similar to each other.
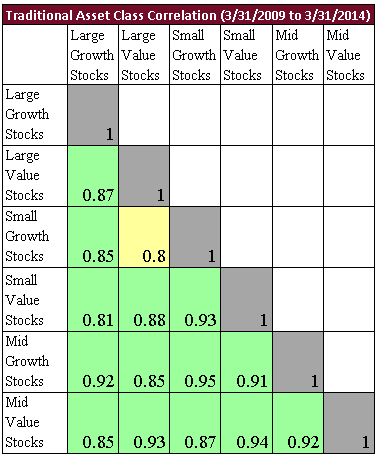
Figure 1*
This is clearly one of the ways in which the application of Modern Portfolio Theory can be improved upon. The correlations among asset classes change over time and, therefore, investors must monitor the correlations within their portfolios to ensure proper diversification. The universe of investments can and should be invested across a wide range of asset classes. And, as the environment changes, the asset classes must not remain static.
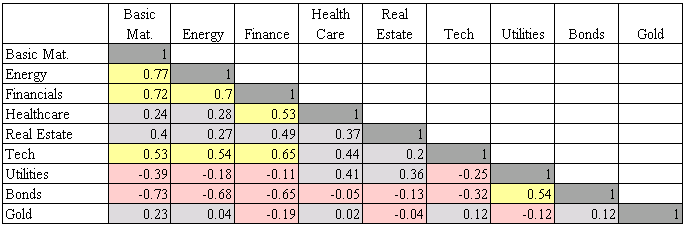
Figure 2*
The technological hardware and software tools available for investment advisors today allow them to determine a broadly diversified portfolio that maintains relatively low correlation among asset classes. In Figure 2 above, we demonstrate such a portfolio. Here, we determined the “primary colors” of the universe of asset classes. The equity asset classes were selected by finding those asset classes that represented the entire universe and were least correlated to each other. For example, Basic Materials was selected. We could have selected Defense, Chemicals or Consumer Durables; they were all highly correlated to each other. However, Basic Materials was least correlated to the other selected asset classes, so Basic Materials was selected to represent that slice of the equity asset universe. The same process was used to select Financials, Technology, Energy, Health Care, Gold, Utilities, etc.
Summary and Conclusion
Today, it is popular to segment the market into categories based on fundamentals and capitalization (large-cap value, large-cap growth, mid-cap value, mid-cap growth, small-cap value, small-cap growth) to represent the whole market. We believe this is a serious error in the way most investment advisors are applying Modern Portfolio Theory. The correlation coefficients among these asset classes have converged in recent years. This convergence significantly impairs the ability of diversification to reduce risk of loss in an investment portfolio.
The ideal portfolio optimization algorithm would apply its asset allocation optimization techniques among equity and fixed income asset classes with low correlation. By comparing the matrix of correlation coefficients in Figure 1 to the matrix in Figure 2, it becomes quite obvious that we are allocating investment portfolios to asset classes with lower correlation. The use of asset classes with substantially lower correlation would likely improve the risk-adjusted return results of any asset allocation algorithm[ii].
[ii] Emphasizing Low-Correlated Assets: The Volatility of Correlation, by William J. Coaker II, Journal of Financial Planning, September 2007
*Figure 1Details
|
Large Size Growth Stocks |
Russell 1000 Growth Index |
|
Large Size Value Stocks |
Russell 1000 Value Index |
|
Small Size Growth Stocks |
Russell 2000 Growth Index |
|
Small Size Value Stocks |
Russell 2000 Value Index |
|
Mid-Size Growth Stocks |
Russell MidCap Growth Index |
|
Mid-Size Value Stocks |
Russell MidCap Value Index |
*Figure 2 Details
|
Material |
Dow Jones U.S. Basic Materials Index |
|
Energy |
Dow Jones U.S. Oil & Gas Index |
|
Finance |
Dow Jones U.S. Financials Index |
|
Health |
Dow Jones U.S. Health Care Index |
|
Real Estate |
Dow Jones U.S. Real Estate Index |
|
Technology |
Dow Jones U.S. Technology Index |
|
Utilities |
Dow Jones U.S. Utilities Index |
|
Bonds |
Barclays U.S. 20+ Year Treasury Bond Index |
|
Gold |
London Gold PM Fix |
Vern Sumnicht has 25 years experience as a successful financial planner and has been recognized for four consecutive years by “Worth Magazine” as one of the Nation’s Top Wealth Advisors. Vern and his team developed iSectors’® diversified ETF allocation portfolios.
©2014 iSectors, LLC. All Rights Reserved.