A persistent reduction in the US inflation rate and well-anchored inflation expectations continue to contradict the common understanding that interest rates have reached a cyclical floor.
The positive real interest rate embedded in the US 10-year Treasury note reinforces its value and the value of the bond market in general. After all, positive real interest rates in the world of zero and/or negative interest rates have value. Saturna Capital uses a number of reference points to gauge the intrinsic value of the US sovereign bond market. As of August 30, 2014, the US 10-year Treasury note yield was 2.34%, which exceeded the yield on 10-year TIPS (Treasury Inflation-Protected Securities) by 2.13%, the dividend yield on the S&P 500 by 0.43%, and the Personal Consumption Expenditure Implicit Price Deflator, a measure of the change in prices of items consumed by households, by 0.87%.
As a result of falling yields and forward breakeven inflation rates, the Citigroup Broad Investment Grade Index 10+ (an index of investment grade securities with maturities longer than 10 years) returned 14.61% for the period June 28, 2013, through August 29, 2014.
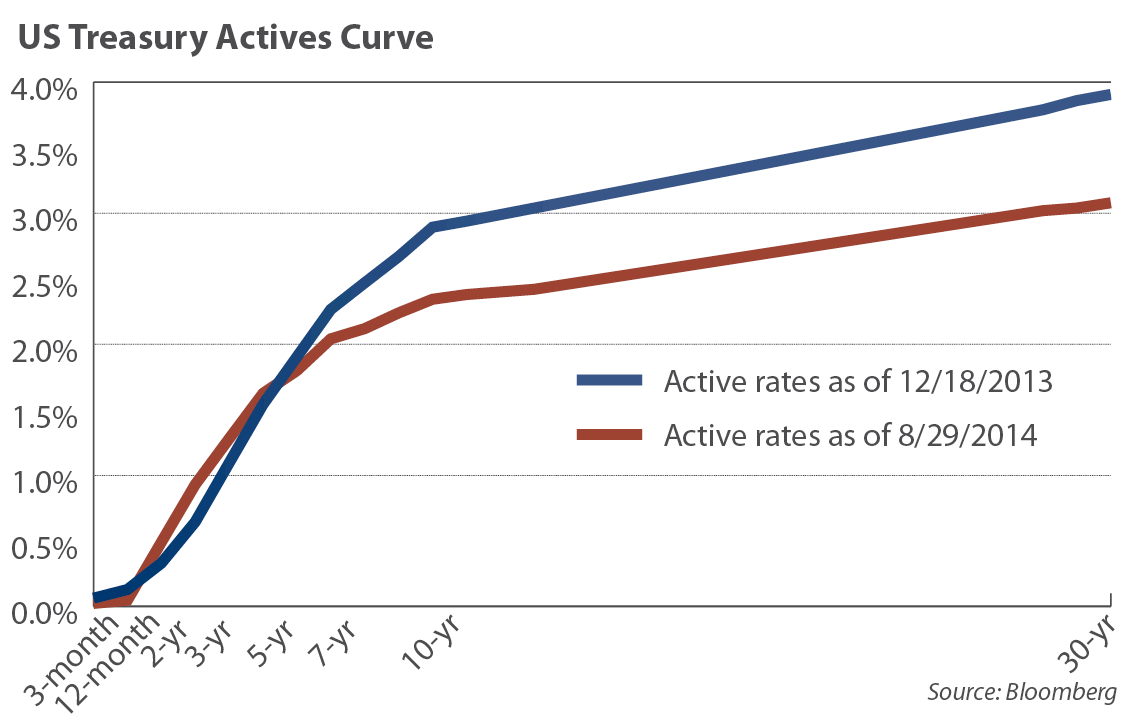
Further, at the end of each round of long-term asset purchases the 30-year bond yield has fallen. Since the Federal Reserve announced the end to its third long-term asset purchase program last December 18, the 30-year bond yield dropped from 3.91% to 3.08% in concert with a substantial narrowing of the difference between short-term and long-term yields.
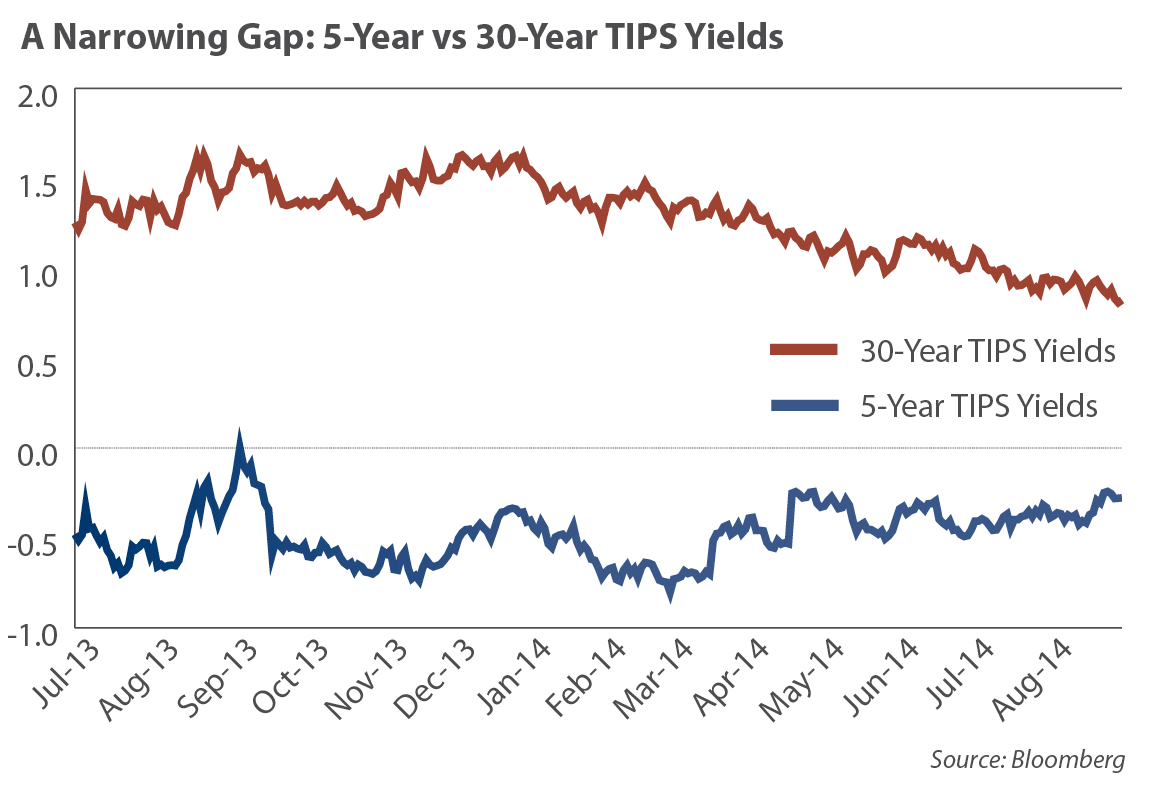
This narrowing was partly due to investors' anticipating the Fed's intent to increase the federal funds rate in mid-2015. More importantly however, since December 18, 2013, the 30-year TIPS yield declined by half from 1.63% to 0.82% while the 5-year TIPS yield dropped from zero to -0.27%. Driven by a decline in inflation expectations this should comfort bond investors and increasingly worry inflation-hungry Fed Governors. Yet, slowing inflation in the US and other G-7 economies tends to be good news for bondholders.
Is the US sliding into a Japan-Style Liquidity Trap?
Alan Greenspan, Ben Bernanke, and Janet Yellen all insisted that Japan's deflationary reaction to deficit financing, zero-interest rates, and quantitative easing would not be repeated in the more diverse and dynamic US economy. The US inflation experience is also beginning to look uncomfortably like Japan's. While Japan and US asset prices have responded positively to monetary and fiscal stimulus, the sought-after reduction in sovereign debt burdens produced by higher inflation has been less than expected. The Fed is searching for explanations for the on-again-off-again economic/inflation recovery. Economists Yi Wen and associate Maria A. Arias of the St. Louis Federal Reserve offered one theory in a recent research paper titled The Liquidity Trap: An Alternative Explanation for Today's Low Inflation:¹
Central bank zero-interest rate policies may depress capital funding to the point of limiting economic activity.
"During a liquidity trap, however, increases in money supply are fully absorbed by excess demand for money (liquidity); investors hoard the increased money instead of spending it because the opportunity cost of holding cash — the forgone earnings from interest — is zero when the nominal interest rate is zero. Even worse, if the increased money supply is through LSAPs [large-scale asset purchases] on long-term debts (as is the case under QE), investors are prompted to further shift their portfolio holdings from interest-bearing assets to cash... The Fed's policy to pay positive interest rates on reserves can only reinforce the problem by making cash more attractive as a store of value."
Such an unprecedented increase in money demand (versus transaction demand) has slowed down the velocity of money (the turnover rate of dollars in the money supply). The authors posit investors are hoarding money because of poor real wage and job prospects as well as excessively low rates of return on interest-bearing investments. In part, they conclude that when the returns on interest-bearing investments fail to compensate for the inherent risks, investors increasingly prefer to hold cash. In other words, central bank zero-interest rate policies may depress capital funding to the point of limiting economic activity.
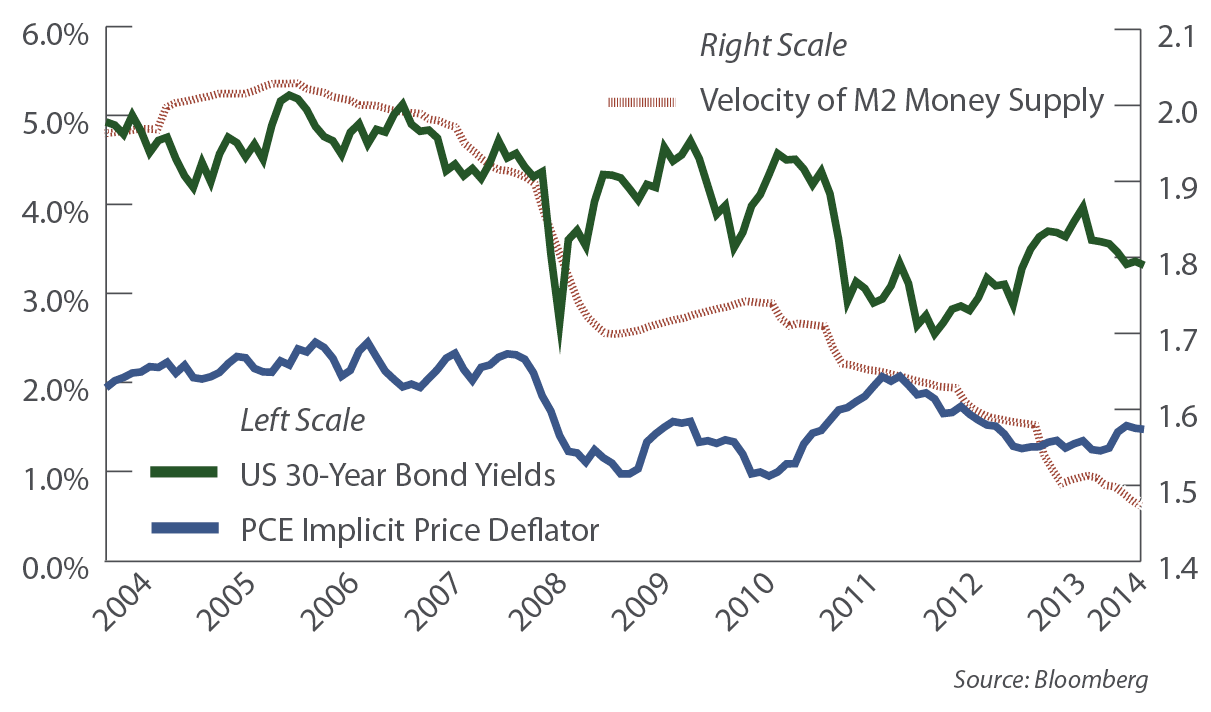
The chart at right offers a 10 year perspective on US inflation using the PCE Implicit Price Deflator, US 30-year bond yield, and the velocity of M2 money supply.
Publishing the Liquidity Trap paper indicates the Fed understands the logical end game for this theory, that interest rates should be increased to boost inflationary expectations and the velocity of money. Of course they will have to be mindful of the inflationary potential of the trillions of dollars of the excess reserves in the banking system.
Leaving this theory aside, there are other issues that may contribute to the unsatisfactory economic recovery these Fed economists are trying to explain. Five years of uncertainty about national health care, job benefits, minimum wages, new Medicare taxes, as well as weakened credit ratings from housing defaults, insufficient retirement savings, flagging state solvency, and a drumbeat of cautious economic forecasts from the Fed may have convinced some individuals and employers to self-insure, to save and hold onto extra cash. Real wage and benefit growth has been insufficient to maintain living standards for many.² In the end, wages have to grow faster than the general price level to create a real inflation threat for bondholders. The US is not there yet.
The Logic of Negative Yields and Negative Interest Rates
Bloomberg Professional Services indicates negative yields occur "when savings returns are less than the rate of inflation plus taxes." Carmen M. Reinhart describes negative yield as a form of financial repression consisting of negative real interest rates that help liquidate the huge overhang of public and private debt and ease the burden of servicing that debt.³ However, these interest rates have historically still been positive numbers.
Negative nominal interest rates are actually below zero. If someone says the return on a 6-month Treasury bill is negative 0.25%, many investors will react with a silent "Wait, what?" Why would anyone invest their money knowing they were certain to lose? There are times when the certainty of a known loss is more appealing than the uncertainty of a potentially much larger loss. Investors temporarily paid for negative yields on US Treasury bills during the 2008 financial crisis as opposed to leaving cash on deposit at Bear Stearns, Lehman Brothers, AIG, or Bank of America. During wars, individuals and corporations may decide to deposit money in foreign banks at negative interest rates to protect their wealth. When the return of money is more important than the return on money, negative rates make perfect sense. Sometimes investors have to pay negative interest rates when they are not allowed to invest in any other asset class. Sometimes there is no better alternative.
Even when no imminent threat to principal is present, an increase in the expected purchasing power of money can create sufficient reason to pay negative interest rates. The more familiar circumstance for investors demanding a real rate of return is to avoid the loss of future purchasing power from a general rise in the level of prices.
But what happens when the general price level falls? The purchasing power of cash on hand will be greater next year than now. This could motivate consumers to hoard cash now in order to buy the same item for less in the future. If consumers expect the general price level to fall 1%, they may be willing to pay the bank -0.10% because the cash will be secure and purchasing power will still rise by 0.90%.
Inflation in the eurozone is getting close to zero. Some countries actually have falling price levels (deflation). The European central bank just reduced the overnight deposit facility rate from -0.10% to -0.20% trying to create a greater disincentive for eurozone banks and depositors to hoard cash.4 However, if the general price level falls by .25%, a depositor's purchasing power still grows 0.05%. Yields on many eurozone short-term sovereign debt instruments have gone negative.
The phenomenon is real. Unfortunately, the forward-signaling effect of negative deposit rates (a weak economic outlook) runs the risk of reinforcing the psychology of deflation and may not produce the desired economic stimulus.
There are countries around the world where domestic inflation is a problem. Brazil, India, Russia, Indonesia, and Turkey would all prefer lower inflation rates. But heavy global debt burdens in G-20 countries and inconsistent economic growth more than offset these cases. Inflation is not yet a global threat to bond investors.
Can the US 10-Year T-note yield decline from here?
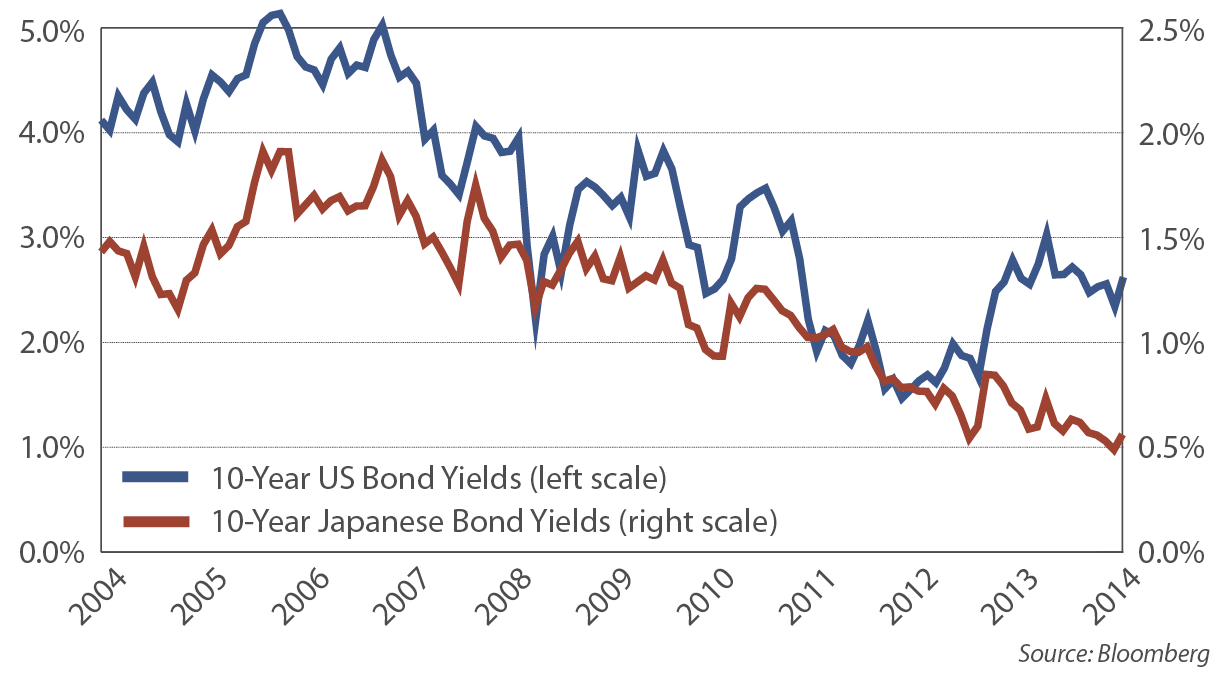
On an absolute basis, the yield on the US 10-year Treasury note is still higher than the 10-year sovereign notes issued by Japan, Taiwan, Hong Kong, Singapore, Canada, France, Germany, Italy, Spain, Sweden, the Netherlands, and Switzerland. The global demand for income and security may push US rates even lower as it has in Japan and the eurozone. A cyclical floor in US rates seem unlikely in the context of how much lower rates are in other heavily indebted economies. Perhaps the Japanese 10-year note is pointing the way for the US 10-year T-note yield instead of the other way around.
In last year's From the Yardarm bond market review (July 2013) we stated, "We do not expect 10-year US Treasury note yields to move up or down more than 1% from a 2.5% fulcrum." For the coming year, we expect the fulcrum to remain at 2.5% and the US 10-year T-note yield to explore the lower half of this range. With the Fed poised to raise short-term rates, and with long-term inflation expectations already well contained, the yield curve may continue to flatten, adding to the risk-adjusted appeal of long-term paper. Global debt deleveraging will continue to overwhelm the fiscal and monetary policies deployed against it, and the deleveraging process is years from completion.
Footnotes
¹ Arias, M.A., Wen, Y. The Liquidity Trap: An Alternative Explanation for Today's Low Inflation. The Regional Economist, April 2014. www.stlouisfed.org/publications/re/articles/?id=2505
² Shierholz, H., Mishel, L. A Decade of Flat Wages: The Key Barrier to Shared Prosperity and a Rising Middle Class. Economic Policy Institute, August 21, 2013. http://www.epi.org/publication/a-decade-of-flat-wages-the-key-barrier-to-shared-prosperity-and-a-rising-middle-class/
³ Reinhart, C.M. Financial Repression Back to Stay: Carmen M. Reinhart. BloombergView, March 11, 2012. http://www.bloombergview.com/articles/2012-03-11/financial-repression-has-come-back-to-stay-carmen-m-reinhart
4 "ECB cuts rates to record low and negative for overnight deposits; Euro/dollar slumps below 1.3" MercoPress, September 5, 2014. http://en.mercopress.com/2014/09/05/ecb-cuts-rates-to-record-low-and-negative-for-overnight-deposits-euro-dollar-slumps-below-1.3
Copyright 2014 Saturna Capital Corporation and/or its affiliates. All rights reserved. Vol. 8 · No. 9
Important Disclaimers and Disclosures
This report is intended only for the information of the reader and is not to be used for or considered as an offer or the solicitation of an offer to sell or buy any securities or other financial instruments of any kind, including without limitation, any mutual fund or other product offered, sponsored, created, or managed by Saturna Capital Corporation or its subsidiaries or affiliates ("Saturna"). This report is not intended for distribution to, or use by, any person or entity who is a citizen or resident of, or located in, any locality, state, country, or other jurisdiction in which such distribution, publication, availability, or use would be contrary to law or regulation or which would subject Saturna to any registration or licensing requirement within such jurisdiction.
This document should not be considered as providing investment advice or services, or any other service offered by Saturna. Saturna may not have taken any steps to ensure that the securities referred to in this report are suitable for any particular investor. Saturna will not treat recipients as its customers by virtue of their reading or receiving the report.
Nothing in this report constitutes investment, legal, accounting, or tax advice or a representation that any investment or strategy is suitable or appropriate to a particular investor's circumstances or otherwise constitutes a personal recommendation to any investor. Saturna does not offer advice on the tax consequences of any investment.
All material presented in this report, unless specifically indicated otherwise, is under copyright to Saturna. None of the material, nor its content, nor any copy of it, may be altered in any way, transmitted to, copied, or distributed to any other party without the prior express written permission of Saturna. Unless otherwise indicated, all trademarks, service marks, and logos used in this report are trademarks or service marks of Saturna.
The information in this report was obtained from sources Saturna believes to be reliable, and Saturna believes the information and opinions in the material are accurate and complete as of the date of this material. However, information and opinions contained herein will change over time and without notice. Saturna has no obligation to update or amend any information or opinions at any time. Saturna makes no representations as to the accuracy or completeness of this material, nor does it have any responsibility to ensure that any other materials, including any containing materially different information, are brought to the attention of any recipient of this report.
Under no circumstances shall Saturna, its employees, or any affiliate be responsible for any investment decision by any recipient. This material is distributed on condition that it will not form the sole basis or a sufficient basis for any investment decision by any recipient. Any recipient who is not a market professional or institutional investor should seek the advice of an independent financial adviser prior to making any investment based on this report or for any necessary explanation of its contents.
Saturna does not provide tax, legal, or accounting advice. Investors should consult their own tax, legal, and accounting advisers before engaging in any transaction. In compliance with IRS requirements, recipients are notified that any discussion of US federal tax issues contained or referred to herein is not intended or written to be used for the purpose of (A) avoiding penalties that may be imposed under the Internal Revenue Code; nor (B) promoting, marketing, or recommending to another party any transaction or matter discussed herein.
The Dow Jones Industrial Average is a price-weighted index of 30 of the largest, most widely held US stocks. The S&P 500 is an index comprised of 500 widely held common stocks considered to be representative of the US stock market in general. The Russell 1000 Growth index is a widely recognized index of large-cap growth stocks. The Russell 2000 Index is comprised of US small cap stocks and measures the performance of the 2,000 smallest US companies in the Russell 3000 Index. The NASDAQ Composite index measures the performance of more than 5,000 US and non-US companies traded "over the counter" through the National Association of Securities Dealers Automated Quotation system. The MSCI EAFE Index, produced by Morgan Stanley Capital International, measures the equity market performance of developed markets in Europe, Australasia, and the Far East. The MSCI Emerging Markets Index, produced by Morgan Stanley Capital International, measures equity market performance in over 20 emerging market countries. Barclay's Capital US Aggregate Bond Index measures the performance of the US bond market. The BofA Merrill Lynch (BAML) US High Yield Index tracks the performance of US-dollar-denominated below-investment-grade corporate debt publicly issued in the US domestic market.
Past performance does not imply or guarantee future performance, and no representation or warranty, express or implied, is made regarding future performance. The price for, value of, and income from any of the securities or financial instruments mentioned in this report can fall as well as rise. The value of foreign securities and financial instruments is subject to exchange rate fluctuations that may have a positive or negative effect on the price or income of such securities or financial instruments. Investors in securities such as American Depositary Receipts — the values of which are influenced by currency volatility — effectively assume this risk.
Please consider an investment's objectives, risks, charges, and expenses carefully before investing. To obtain this and other important information about the Amana, Sextant and Idaho funds in a current prospectus or summary prospectus, please visit www.saturna.com or call toll free 1-800/SATURNA. Please read the prospectus or summary prospectus carefully before investing.
The Amana, Sextant and Idaho Tax-Exempt Funds are distributed by Saturna Brokerage Services, member FINRA / SIPC. Saturna Brokerage Services is a wholly-owned subsidiary of Saturna Capital Corporation, adviser to the Amana, Sextant and Idaho Tax-Exempt Funds.