With Q3-14 reported earnings just beginning, here is the latest update of my ongoing "thought experiment" for forecasting the S&P 500 price based on earnings fundamentals. The chart below is based on the latest trailing twelve-month earnings (TTM) data published on the Standard & Poor's website as of October 9th, 2014. The numbers are from the spreadsheet maintained by senior analyst Howard Silverblatt. See dshort's monthly valuation update for instructions on downloading the spreadsheet.

Here are the key assumptions in the calculations:
- The 10-year average of nominal TTM earnings is 65.52 as of September 2013, rising to 78.02 by the end of 2015, based on "as reported" earnings forecasts.
- The average nominal cyclical P/E10 is currently 18.26.
- The S&P 500 historic prices used in the calculations are monthly averages of daily closes.
- Standard & Poor's estimates of TTM earnings for Q4 2013 through Q4 2015 consist of the following:

- The months between the quarterly earnings estimates are linear interpolations.
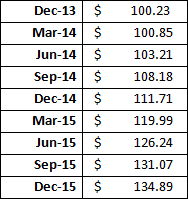
The blue line represents Standard & Poor's TTM forecast earnings by month multiplied by the historical nominal 10-year P/E ratio. At 2014 year-end earnings of $111.71 and an average nominal P/E of 18.26, we would see the S&P 500 at 2040. At this level, the nominal P/E10 would be 28.58, and the index would be about 54% above a hypothetical price multiple of the extrapolated 10-year earnings average (1312).
The red line represents a hypothetical S&P 500 price that is a multiple of the average nominal P/E10 of 18.26 and the 10-year average earnings of 66.85 for December 2013. The monthly index price estimates thereafter are linear extrapolations based on average 10-year earnings growth and earnings estimates from Standard & Poor’s.
The optimistic view (blue line) would put us around 1997 in the S&P 500 at the end of October, the assumptions being that the Standard & Poor's earnings forecasts are correct the nominal P/E10 ratio is the multiple we see.
The pessimistic view (red line) is a reversion to the historic earnings and nominal P/E10 multiple.
But history shows us that, regardless of your preferred earnings divisor (nominal or real, TTM or the 10-year average TTM), the P/E ratio has never hovered around the average. The market swings above and below its long-term average valuation in erratic arcs that can last for many years. For a long-term perspective on valuation extremes, Four Market Valuation Indicators and the compelling research of Ed Easterling on the history of earnings per share.
Check back next month for a new progress report.
Note from dshort: For some interesting comparisons, here are Chris's charts from the last several months, based on the then current Standard & Poor's spreadsheets.


