Despite Volatility, This Bull Is Likely to Charge Higher
We believe:
- Global GDP growth will likely be in the 2.0%–3.0% range, supported by highly accommodative monetary policy
- The U.S. is in the 5th or 6th inning of recovery, with slow but improving growth
- The euro zone is the biggest threat to our forecast of global growth, but ECB and EU leaders will figure out a way to work together to rekindle European growth
- Despite the surge in volatility, this bull market has more room to run
- A balance of secular and cyclical growth companies presents the most attractive portfolio for this mid-cycle phase
As the fourth quarter begins, the market has found itself engulfed in anxiety. After worrying that too much growth would result in an early Fed rate hike, investors are now worried that too little growth in Europe will lead the global economy back into recession. European Central Bank and German financial officials remain bitterly at odds about the benefits of quantitative easing, geopolitical concerns have soured business confidence, and deflationary pressures are seemingly everywhere. Adding to euro zone woes are the threat of a global Ebola crisis, disappointing U.S. retail sales data, and the potential impact of a strong dollar on corporate profit growth.
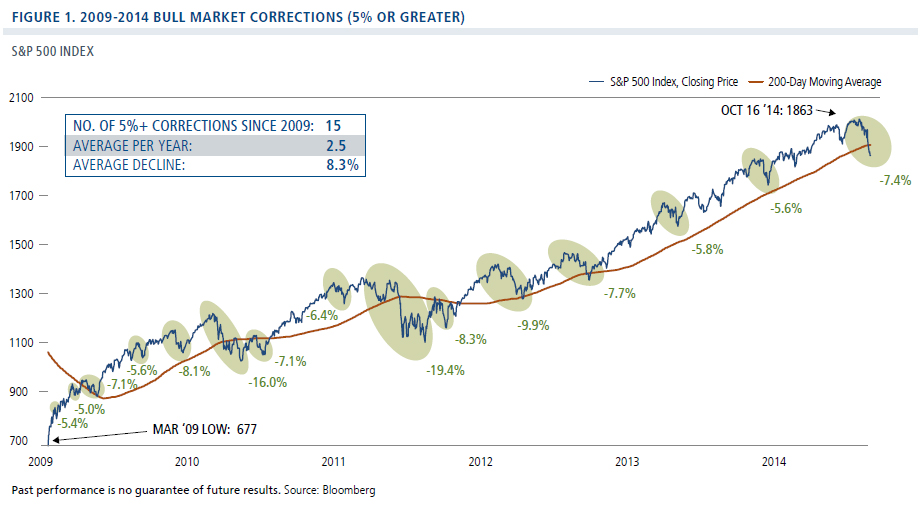
Against this backdrop, volatility has surged in the equity markets while the 10-year Treasury yield has dropped to 2%, leading some to question whether this bull market is breathing its last breath. In these first weeks of October, we’ve seen the market fall -7% from its peak (Figure 1), with the S&P 500 Index breaching its 200-day moving average on October 13. However, corrections have become a routine part of this bull market. Since March of 2009, there have been 15 corrections of 5% or more. Prior to this, the most recent downturn was the 6% correction in January, which also resulted from concerns about slowing global economic growth. The question remains: Is this correction more like August 2011’s decline of 19% when the European debt crisis erupted, or more like the 2013–2014 “pauses” that simply refreshed an otherwise healthy bull?
We expect markets to remain turbulent in the near term as investors digest European economic data and additional likely Ebola cases. Ultimately, we believe the U.S. stock market can resume its upward course and reach new highs, with particularly attractive prospects among secular and cyclical growth stocks. While the backdrop is far more uneven among global economies, we are finding select opportunities among companies positioned to benefit from a slow-but-steady U.S. economic recovery, declining commodity costs, and positive economic reforms.
In the midst of the volatile selling and often dire headlines, there are many positives that can help move the market forward. These positives include a likely acceleration of U.S. economic growth for the second half of 2014 to at least 3%, and the Fed’s recent indications that it may forestall interest rate hikes if global growth remains weak. Global inflation is nearly non-existent, while lower oil prices essentially provide a global tax cut and give central banks more room to maneuver. Corporate profit growth is likely to remain 6%–7%, and we believe that a strong dollar would likely clip earnings only slightly. Given the extreme spreads between corporate borrowing costs and current earnings yields, merger-and-acquisition and buyback activity has been robust, providing a floor for the market. And as we will discuss further, stocks remain attractively valued relative to risk-free rates. Finally, although there have been some disappointments, we believe that good earnings announcements from key bellwethers can alleviate some of the market’s anxiety.
Market Review
During the third quarter, the U.S. markets led, but gains were more modest due to concerns regarding Fed policy, global growth, and geopolitical tensions. A sense of uncertainty hit the markets particularly hard toward the end of the quarter as concerns of low global growth and deflation contributed to an implosion in energy and commodity costs. In the U.S., stocks bounced back as the Fed maintained a soothing tone, data suggested that the U.S. recovery remained on track, and earlier tensions between Russia and Ukraine did not escalate significantly.
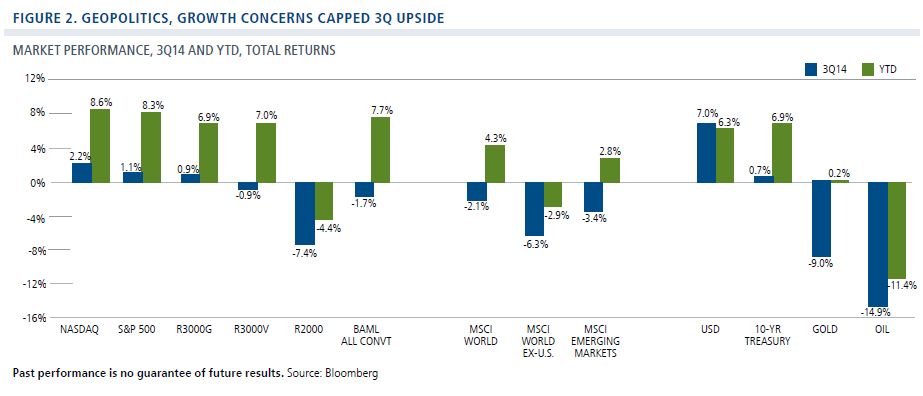
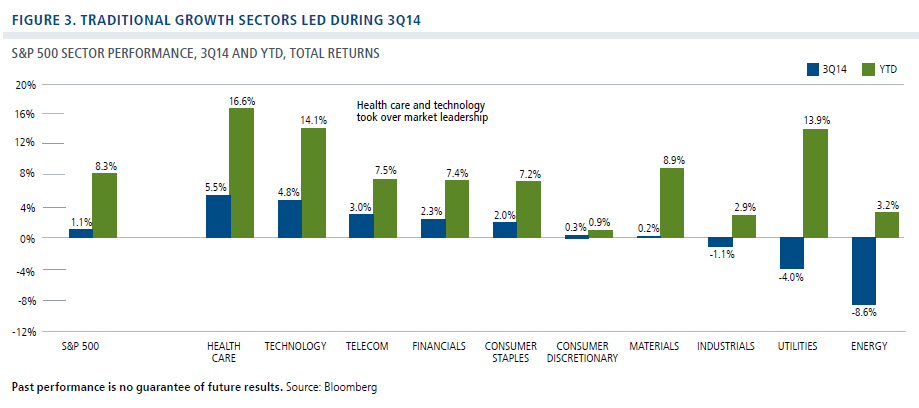
In the U.S. markets, a growth regime continued to unfold, with growth outperforming value in the broad equity market (Figure 2). Health care and technology assumed market leadership for both the quarter and year-to-date periods, while the energy, utilities and industrials sectors retreated (Figure 3). Anxiety about growth and interest rate concerns also took a toll on the more economically sensitive Russell 2000 Index, particularly its smallest constituents. These concerns rippled across the convertible market, as many convertible issuers are small-cap and mid-cap companies.
While U.S. equities weakened in the final weeks of the quarter, non-U.S. equities continued their slide in the face of mounting evidence of a euro zone slowdown, differences of opinion between ECB and German finance officials about the efficacy of QE, and Europe’s closer proximity to geopolitical epicenters. Emerging markets faced especially stiff headwinds due to concerns about a strengthening dollar, falling commodity prices and gradually rising interest rates.
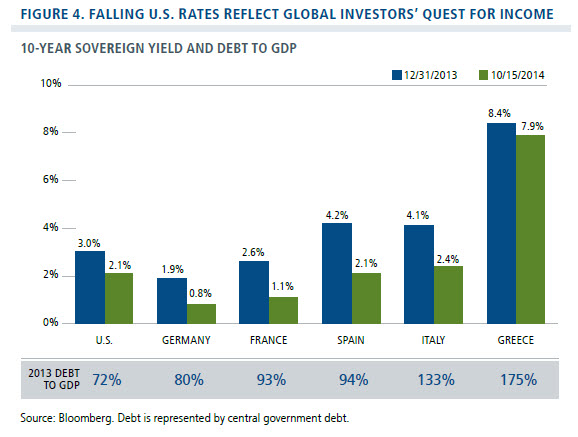
Meanwhile, the 10-year Treasury posted an essentially flat return, yielding 2.5% at both the start and end of the quarter as European and Japanese investors pushed down U.S. long-term yields in a quest for income (Figure 4). Rates have fallen sharply since the quarter ended, largely in response to significantly weaker data points out of Europe. We expect long-term interest rates will remain in the 2.0%–2.5% range as anxious investors seek shelter in the safety of U.S. Treasury bonds.
Outlook
We expect global GDP expansion of 2.0% to 3.0% for 2015, as global monetary conditions remain accommodative, and inflation almost non-existent in developed markets and on the decline in emerging markets. Europe and Japan growth may contribute little if anything to global growth in 2015, but we believe this weakness will be offset by the U.S. and emerging markets.
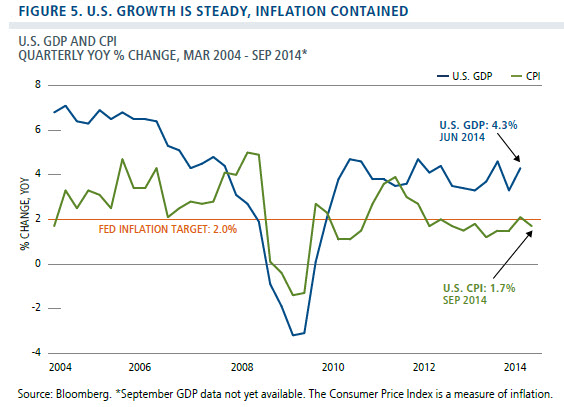
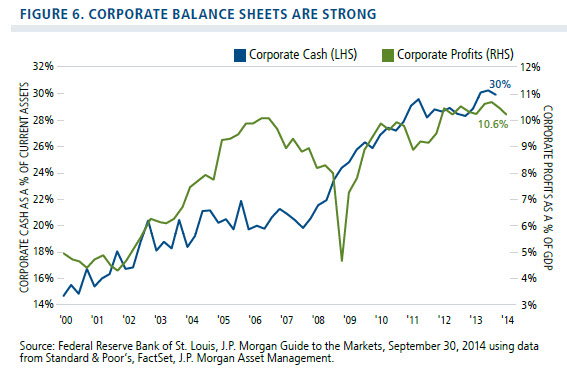
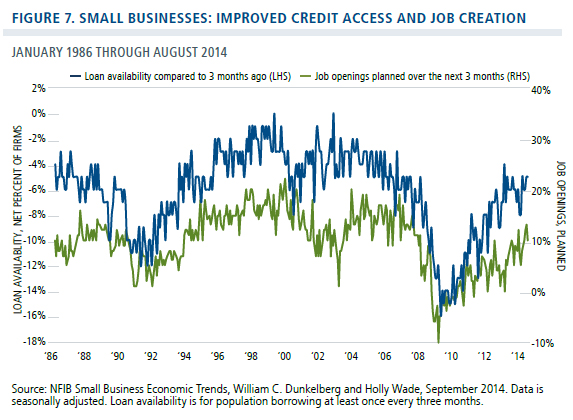
The U.S. recovery looks set to firm as we enter 2015, and we still believe we are in the fifth or sixth inning of the recovery. U.S. GDP growth has remained steady and inflation contained (Figure 5). Unemployment has dropped below 6%, with the economy adding 10 million jobs since 2011, versus 8.8 million lost during the recession. Consumers continue to spend, although September retail sales were weak, and auto sales have remained strong. U.S. companies have record cash stockpiles, and corporate profit growth is likely to be in the 6% to 7% range for 2015 (Figure 6). Small companies are also reporting greater access to credit and more planned hiring (Figure 7). Against this backdrop, we expect U.S. GDP growth of around 3% for the second half of 2014 and 2015.
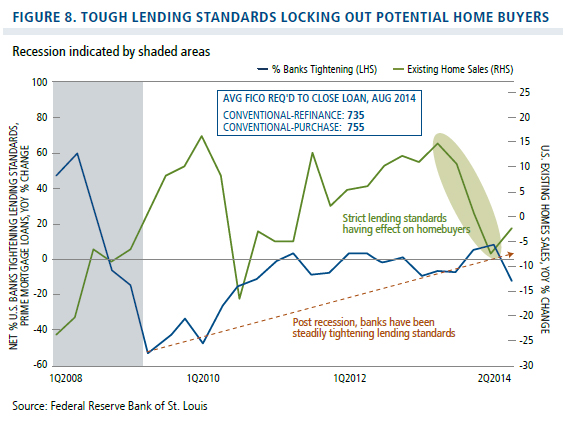
Of course, there are still hurdles to U.S. economic growth. The pace of the recovery has been hindered by a fractious political environment and lack of stimulative fiscal policy. Banks continue to struggle with regulatory uncertainties, and this has been a principal factor stalling the housing recovery. As lenders grapple with complex and conflicting criteria, borrowers without exemplary credit scores have found themselves locked out of the market (Figure 8). And anecdotally, when former Fed Chair Ben Bernanke reports he can’t refinance his mortgage, it’s a telling indication of how far the pendulum has swung.
U.S. Stocks Can Move Higher
Our 12-month price target on the S&P 500 remains in the 2150–2200 range, based on S&P 500 earnings of $124, and the normal multiple of 17x–18x that has been associated with 3%-4% long-term interest rates, and inflation of 2%. Reflecting our view that we have entered a growth regime but are not yet in a late-cycle environment, we are favoring a combination of secular and cyclical growth companies in sectors including technology, health care, consumer discretionary, and financials. Companies in these sectors have also tended to do well when interest rates rise.
At this point, we do not view a stronger dollar as posing a significant risk to U.S. companies’ profit growth in the fourth quarter of 2014 or in 2015. There may be a downward pull on some companies’ earnings guidance for 2015, and we are closely analyzing companies’ revenue sources from this perspective. Ultimately, we believe markets will recognize that the strong dollar will likely be only a near-term headwind.
Given weaker growth in Europe and Japan, the Fed may allow inflation to move higher than 2.0%, to ensure that the U.S. economy has sufficient trajectory to lift off. At this point, we believe this means that the Fed will not raise rates before mid-2015. When rates do rise, the markets may well experience short-term volatility. Longer-term, however, equities have typically performed well when rates have moved modestly higher, as it usually signals an economy that is expanding.
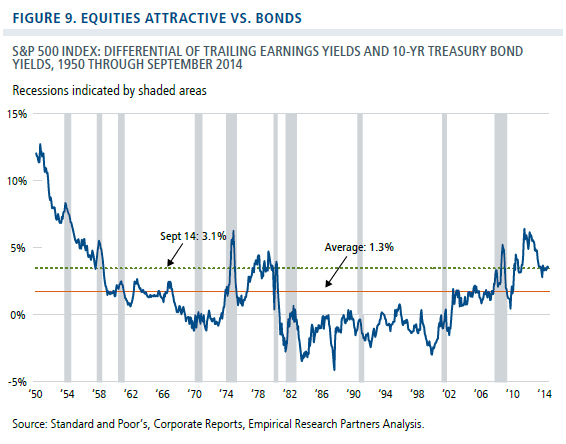
Despite the five-and-a-half year bull market, U.S. equity valuations remain in the least expensive quartile over the past 65 years. Based on a 10-year Treasury yield of 2.3% and an E/P ratio of 6.6% (inverse of 2015 P/E ratio of 15.1x), the spread is 4.3%. For stocks to be viewed as fairly valued relative to historical levels over the past 65 years, the 10-year Treasury yield would have to rise to 4.1% or the S&P 500 earnings yield would have to fall to 4.8%, or a 2015 P/E of 21x.
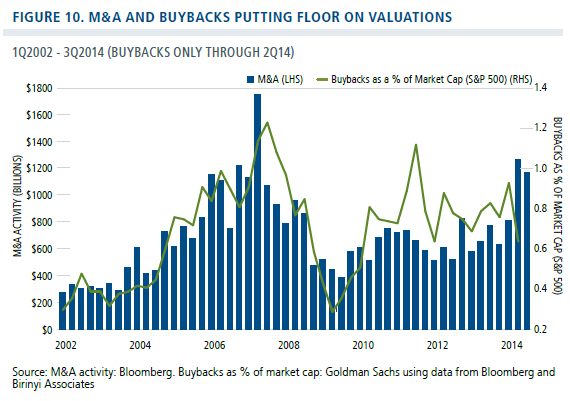
Merger and acquisition activity and share buybacks have provided a tailwind to the U.S. equity market (Figure 10). During the first half of 2014, M&A and buyback activity was the strongest since 2007, and we expect this to continue, especially as the spread between S&P 500 earnings yields and corporate debt costs is near levels not seen since the late 1970s. M&A and buybacks offer an effective floor on valuations because any weakness in stocks encourages companies to buy back their stock or that of another company. With the Fed unlikely to raise short-term rates until mid-2015 and European investors pushing down U.S. long-term yields in a quest for income, we expect M&A and buyback activity to remain robust.
Why Growth Stocks?
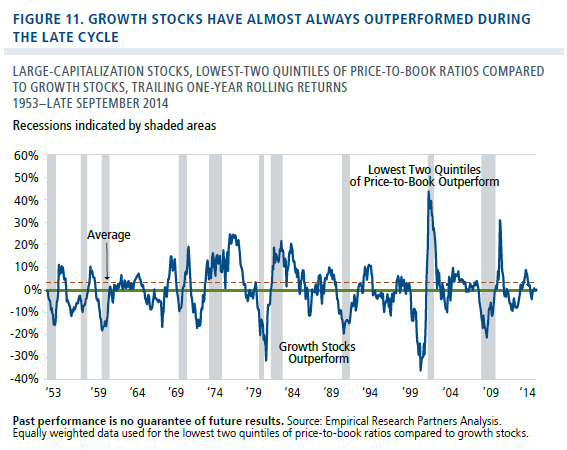
After five years of what has largely been a value regime and the considerable defensiveness during the first half of this year (when large-cap growth stocks lagged value stocks by some 200 basis points), we believe the market has moved into a growth regime. Growth regimes generally occur during the latter and most robust part of the business cycle (Figure 11). The last such growth regime occurred from 2005 to 2007 and before that, we had a growth regime from 1996 to early 2000.
Historically, several conditions characterize growth regimes, according to Empirical Research Partners, which has done considerable work on the topic. These characteristics include:
- A flattening of the yield curve (off already low rates)
- A narrowing of the percent of companies generating margin improvement
- The market rewards companies with high capital spending and cash reinvestment
- Higher-volatility names perform well on a riskadjusted basis
- Valuation spreads between growth and value are narrow
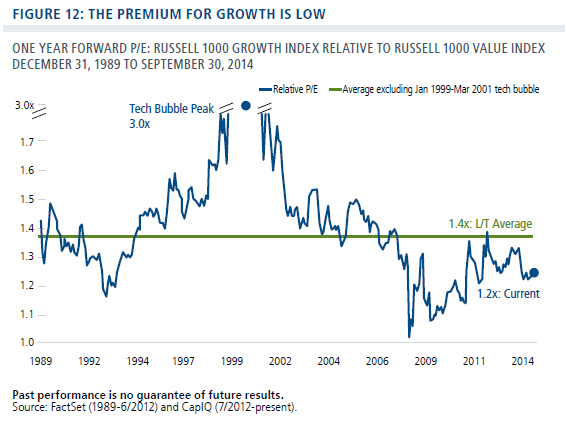
As we can see in Figure 12, the growth premium is below long-term averages. Currently, large-cap growth stocks trade at 1.2x large-cap value stocks, versus a long-term average multiple of 1.4x. Moreover, the present growth premium is far below the 3.0x peak reached at the height of the 2000 tech bubble. Looked at differently, the P/Es of the top decile of growth companies currently trade at 1.8x the overall universe of growth stocks, far below prior peaks of 4.5x at the top of the 2000 tech bubble and 3.0x at the 1972 top of the Nifty Fifty run.
While we believe the opportunity is pronounced among large caps, we see opportunities across the capitalization spectrum. As we discussed, U.S. small caps sold off sharply in the third quarter, hindered by concerns of higher interest rates and slowing economic growth. We believe better economic growth in the U.S. and a continued flurry of M&A activity can rekindle market interest in smaller companies. Moreover, compared with larger companies, smaller companies have far less sales and overall exposure to non-U.S. markets, which could insulate them from the headwinds of a strong dollar.
We believe this growth regime still has plenty of time to run its course. As we have discussed in past commentaries, we expect this recovery cycle will be longer than historic norms because the Great Recession resulted from a financial crisis rather than a cyclical downturn. While we have seen an uptick in capital spending, we have not seen the surge in spending that is typically indicative of a latecycle environment. And while employment data is improving, we haven’t seen the terminal velocity in job growth required for the economy to take off—250,000 to 300,000 new jobs for several consecutive months.
The Euro Zone Remains the Biggest Risk
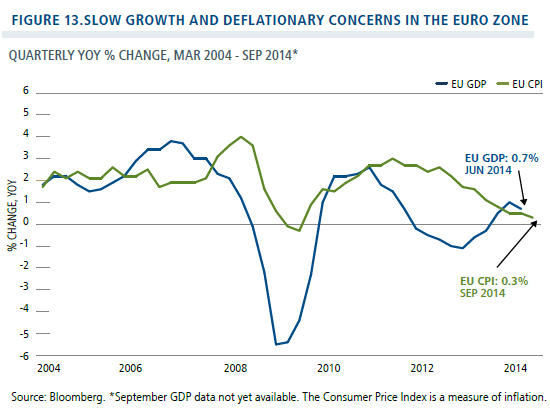
Economic conditions in the euro zone represent the biggest risk to our generally bullish global outlook. We expect the euro to continue to weaken and that the euro zone could slip back into recession absent strong fiscal stimulus. Europe lacks the fundamental tailwinds that are fostering a sustainable recovery in the U.S. (Figure 13). These deteriorating economic conditions have prompted the ECB to implement quantitative easing at the same time the Fed is winding down its QE program. However, the very public disagreement between the ECB and the Deutsche Bundesbank about the ECB’s proposed €1 trillion QE program markedly reduces the ability of central banks to steer the EU away from the recessionary trajectory.
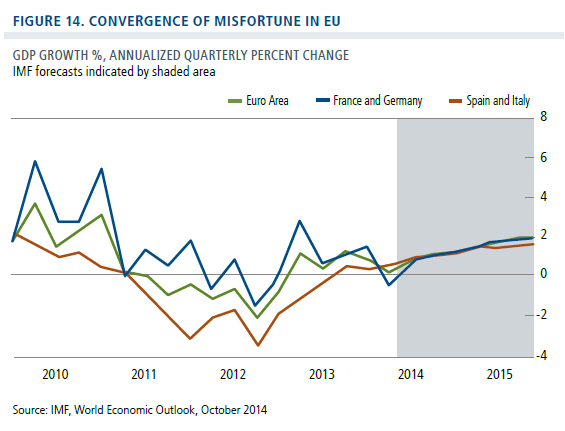
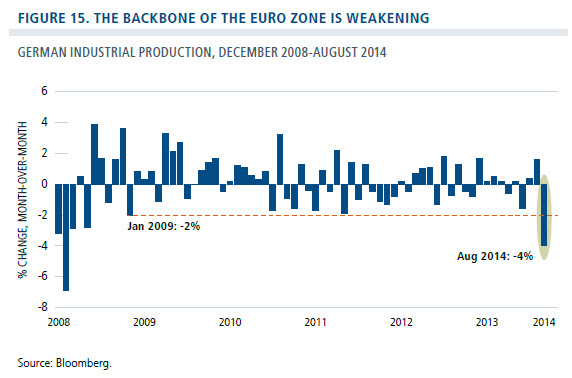
Close interdependency among EU nations and heightened geopolitical risks have led to less bifurcation between northern and southern economies and perhaps an unrealistically optimistic view of improvement over the next 18 months (Figure 14). During recent weeks, we’ve seen a steady string of discouraging news out of the core economies, including France’s unwillingness to meet austerity targets, and negative manufacturing and industrial data from Germany. As Figure 15shows, industrial production in Germany posted its largest decline since January of 2009.
Although sentiment had been on the upswing, business and consumer confidence have weakened more recently, due to the euro zone’s geographic proximity to the Middle East and Ukraine, Europe’s closer economic ties to Russia, and the run-up to Scotland’s independence referendum. Ongoing domestic political tensions, particularly in France and Greece, have also cast a shadow.
Ultimately, we believe the ECB and German officials will find a way to agree to do what is necessary to prevent the euro zone from deflating with both accepting QE and structural reforms that can foster long-term growth prospects. More aggressive action from the ECB will bolster asset prices, in turn leading to improved sentiment and better economic activity. We believe the most effective measures would include fiscal reforms in France and Italy and measures to promote spending in Germany and Belgium, rather than QE.
More immediately, we are in a wait-and-see mode. Our approach has been to focus on recent price weakness to position ourselves for an eventual bounce in risk assets. Potential reflationary beneficiaries include companies in real estate and asset management. In regard to security selection, we are favoring companies exposed to secular growth or growth outside of Europe, such as multinationals and exporters that can benefit from a weaker euro. We are monitoring opportunities emerging from the ECB’s formal assumption of bank supervision responsibilities, as well as the recently announced targeted long-term refinancing operation, asset backed security and covered bond purchase programs.
Japan: Sustainable Growth Remains Elusive
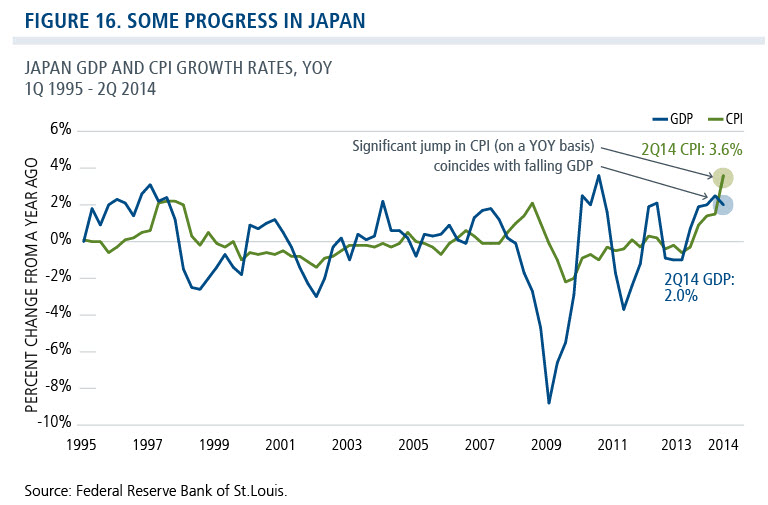
In Japan, economic data has been mixed-topositive and our outlook on the Japanese economy remains generally unchanged from the past quarter. Additional stimulus in 2014 and pension reform could provide macro-level catalysts, and valuations are reasonable. However, we are still cautious given the structural challenges that remain—high debt levels, demographic headwinds and fiscal policy. We are identifying additional opportunities at the margin, but this is still very much a bottom-up market for us and we are not yet confident the economy is on a sustainable growth path (Figure 16).
Similar to Europe, we are favoring companies that could benefit from a weaker currency (e.g., exporters) and/or more stimulative monetary policy (financials, real estate, asset managers) and select secular growth opportunities, including within the industrials sector. The next round of value-added-tax increases will be another test in a long-road toward recovery. The Bank of Japan continues to do the heaviest lifting when it comes to monetary policy, which should be positive for reflation plays and exporters but a negative for the yen.
EMs: Return to Fundamentals?
We expect continued choppiness in the emerging markets, as the market wrestles with global and economy-specific uncertainties. Earlier in the year, we were disappointed by the market’s preference to favor twin-deficit economies such as Brazil and Turkey, as well as state-owned enterprises (SOEs) with low growth potential. However, in recent weeks, we have been encouraged by what appears to be an increased focus on sustainable growth attributes, viewing this shift as a positive for our active and risk-conscious approach. The next leg of emerging market equity performance could very well see a different leadership group, focused on economies with better fundamentals and reform initiatives and on companies that can grow their intrinsic value over time. In this environment, we are emphasizing commodity-consuming EMs, such as China, India and the Philippines, as well as exporters, such as Taiwan and South Korea.
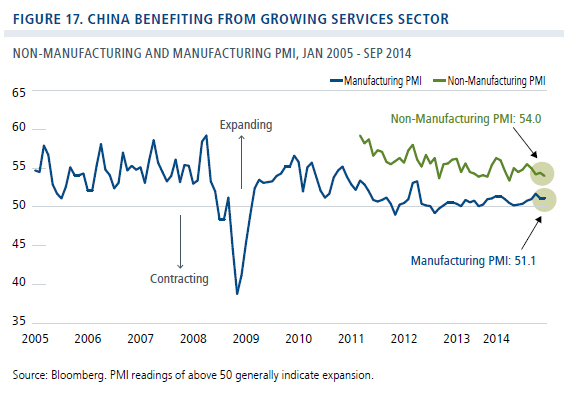
In regard to China, we expect a continued deceleration in growth as the economy shifts from SOE investment led growth to private enterprise, services, and domestic consumption-led growth. Manufacturing PMI has not staged a sharp rebound but it hasn’t dipped to contraction levels. Non-manufacturing PMI has given the economy a boost, demonstrating both the power of China’s growing consumer class and the ongoing maturation and diversification of the Chinese economy overall. We are also remaining vigilant to credit risk in the Chinese economy, as the government seeks to moderate loan growth without taking too much liquidity out of the market. China’s trust system has avoided the wave of defaults that many expected this year by rolling assets into new trusts, moving assets back on to bank balance sheets or selling assets to government entities. Ultimately, however, our view is that China will be able to avoid a financial crisis as it continues to build its private sector—helped by its $4 trillion in reserve currency.
In contrast, we are highly cautious regarding most commodity-producing economies, such as Russia, Brazil and South Africa, as these economies may be more vulnerable to a stronger dollar and the spillover from deteriorating euro zone growth. Russia also must contend with weighty sanctions meted out in response to its stance on Ukraine. While we are generally cautious about commodity-producing economies, we are more constructive on Mexico, due to its close ties to the U.S. economy and its reform agenda, both of which should help bolster its growth prospects.
Our positioning continues to emphasize countries actively pursuing economic reforms, including India, where Prime Minister Modi was elected on a platform of economic development. Based on our travel to India and many conversations with company management teams, we believe that Modi could usher in a new era of lasting economic growth. We are also encouraged by China’s commitment to financial market transparency, including allowing for increased foreign ownership of Chinese companies through the Hong Kong exchange. The protests in Hong Kong gave us pause, and we will be watching the landscape for renewed signs of social unrest. We traveled to Hong Kong earlier in October, and at this point, we believe the broad-based impact will be limited as these protests have been more like Occupy Wall Street than the Arab Spring.
Global Convertibles: Attractive Opportunities
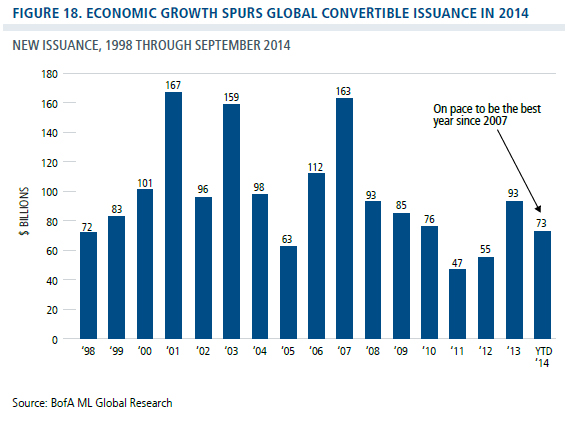
We see attractive prospects in the convertible market, where issuance has increased as economic recovery progresses. With $73 billion in issuance through September, global issuance is on pace to be at its highest level since 2007 (Figure 18). We’ve seen healthy sector breadth in issuance, as well as regional diversification. We’re also excited that a number of “household name” companies have chosen to issue convertibles, viewing this increased adoption as a decided positive for the asset class.
We believe that the case for convertibles is compelling in this environment, as convertibles typically benefit from volatility in an ultimately upward moving equity market. Moreover, valuations for convertibles (as represented by the BofA ML All U.S. Convertibles Index) are the best they have been since May of 2009. However, the turbulent environment heightens the need for active management, given the varying degrees of equity sensitivity among individual convertibles. In this environment, we continue to favor securities with a balance of equity and fixed-income characteristics, rather than those which are disproportionately equity or credit sensitive.
Interest rates have stayed low despite the Fed’s tapering of quantitative easing and indications that rates would rise in 2015. Given the volatile environment we’ve seen in recent weeks, interest rates will likely stay low over the near term and could fall further from here. However, we continue to believe that investors will be well served to seek more diversified sources of income now, rather than when rates rise. Due to their equity characteristics, convertibles can provide advantages over traditional bonds in rising-rate periods, while their fixed-income attributes can mitigate short-term equity market volatility.
Conclusion
Our view remains that the market will shake off its current concerns about global growth slowing and Ebola becoming a pandemic, and move to new highs. While we believe additional Ebola cases could emerge in the U.S. and Europe, high awareness and improving procedures for treatment should allow those who contract the disease to get better, thereby reducing the uncertainty and fear associated with its spread.
As to Europe, we believe the ECB and German finance officials will find ways to work together to both implement QE and put in place structural reforms to rekindle long-term growth. Meanwhile, in the U.S., economic growth continues to strengthen, driving good corporate profit growth amidst a backdrop of continued low inflation and low interest rates. Finally, valuations remain compelling, causing corporations to continue to pursue deals and buy back stock, which put a floor on the market. While it will likely be a rocky path, we believe the market can move to new highs by early 2015.
The S&P 500 Index is considered generally representative of the U.S. equity market. The MSCI World Index is considered generally representative of the market for developed market equities. The MSCI World ex-U.S. Index is a market capitalization weighted index composed of companies representative of the market structure of developed market countries in North America (excluding the U.S.), Europe and Asia Pacific regions. The MSCI Emerging Markets Index is a free float adjusted market capitalization index cited as a measure of the performance of emerging market equities. The Nasdaq Index is an index composed of stocks that are listed on the Nasdaq stock exchange. The Russell 3000 Growth Index is considered generally representative of the U.S. growth stock market. The Russell 3000 Value Index is considered generally representative of the U.S. value stock market. The Russell 2000 Index is considered generally representative of the U.S. small-cap stock market. The BofA Merrill Lynch VXA0 Index is considered generally representative of the U.S. convertible market.
Price-to-earnings ratio (P/E) is a valuation ratio of a company’s current share price compared to its per-share earnings.
Price-to-book value is a valuation of a company’s current share price compared to its book value per share. A 200-day moving average is a security or index’s average closing price over the past 200 days. Earnings yield is earnings divided by stock price. Quantitative easing refers to central bank bond buying activities.
This material is distributed for informational purposes only. The information contained herein is based on internal research derived from various sources and does not purport to be statements of all material facts relating to the information mentioned, and while not guaranteed as to the accuracy or completeness, has been obtained from sources we believe to be reliable.
Opinions, estimates, forecasts, and statements of financial market trends that are based on current market conditions constitute our judgment and are subject to change without notice. The views and strategies described may not be suitable for all investors. References to specific securities, asset classes and financial markets are for illustrative purposes only and are not intended to be, and should not be interpreted as, recommendations.
Outside the U.S., this presentation is directed only at professional/sophisticated investors and it is for their exclusive use and information. This document should not be shown to or given to retail investors.
Investments in overseas markets pose special risks, including currency fluctuation and political risks, and greater volatility than typically associated with U.S. investments. These risks are generally intensified for investments in emerging markets.
The price of equity securities may rise or fall because of changes in the broad market or changes in a company’s financial condition, sometimes rapidly or unpredictably. These price movements may result from factors affecting individual companies, sectors or industries.
Fixed-income securities are subject to interest rate risk. If rates increase, the value of fixed-income investments generally declines.
NOT FDIC INSURED | MAY LOSE VALUE | NO BANK GUARANTEE
Unless otherwise noted, index returns reflect the reinvestment of income dividends and capital gains, if any, but do not reflect fees, brokerage commissions or other expenses of investing. Investors may not make direct investments into any index.
Calamos Investments LLC
2020 Calamos Court | Naperville, IL 60563-2787
800.582.6959 | [email protected]
Calamos Investments LLP
No. 1 Cornhill | London, EC3V 3ND, UK
Tel: +44 (0) 20 3178 8838 | www.calamos.com/global
© 2014 Calamos Investments LLC. All Rights Reserved.
Calamos® and Calamos Investments® are registered trademarks of Calamos Investments LLC


