Nobody buys a house without looking inside. And nobody should make investment decisions without doing their due diligence on the underlying fundamentals. But that is exactly what happens in an investment world increasingly driven by high-level asset allocation and utilization of passive, index-based products or strategies. Pundits look at aggregate index data and declare one country cheap (or some other action-inducing characteristic) vs. another. Maybe they are right, but maybe they are missing something too.
Index valuations tell one story, but digging deeper can tell another. For example, investing in Chinese state-owned or heavily influenced companies differs greatly from investing in independent entities that are incented by profits and treatment of their equity owners. Government-related businesses remain a huge influence on Chinese indices when weighted by market cap; these businesses trade at significantly lower valuations than their independent competitors (Exhibit 1). Based on economic performance, this discount seems justified. Growth and returns on capital have been far superior where government influence is less of a factor. This specific issue (stripping out SOE influence to compare like-for-like independent companies) carries over to many other countries and regions, particularly in emerging markets.
Exhibit 1: Government-related businesses trade at significantly lower valuations than their independent competitors
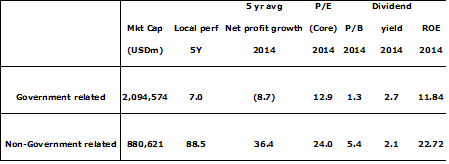
Source: CLSA
Another issue is that index composition can shift over time, making historical comparisons less relevant. For example, there have been growing calls for increased weight to Europe based on valuation and that region’s recent underperformance. After examining the data, we are not convinced that this is the right conclusion to draw. Yes, Europe has underperformed and yes, it trades at a lower current P/E multiple than the U.S. But how does that compare with history and, how might the details of the two regions’ corporate constituents matter? In fact, valuations are at average relative levels vs. recent history, despite the significant recent underperformance of European equities (Exhibit 2).
Exhibit 2: MSCI eurozone 12-month forward P/E relative to U.S.
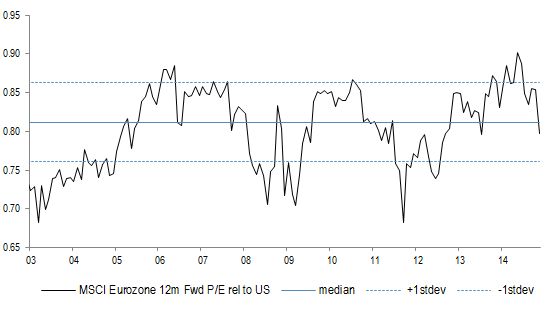
Source: IBES
Digging a little deeper, one can also see that after accounting for index composition differences, the valuation disparities seem even less compelling. The table below examines valuations of trailing P/E ratios for the regional constituents within the MSCI All-Country World Index. The more one lines up like-for-like sectors and industries, the closer the valuations appear.
|
P/E |
|
Count |
|
Percentage (Count) |
|||||||
|
|
Europe |
US |
Global |
|
Europe |
US |
Global |
|
Europe |
US |
Global |
|
Consumer Discretionary |
18.3 |
20.5 |
17.2 |
|
67 |
106 |
342 |
|
15% |
17% |
14% |
|
Consumer Staples |
21.0 |
22.0 |
23.4 |
|
41 |
44 |
201 |
|
9% |
7% |
8% |
|
Energy |
11.1 |
16.8 |
12.5 |
|
25 |
55 |
168 |
|
6% |
9% |
7% |
|
Financials |
12.4 |
16.9 |
12.3 |
|
106 |
114 |
553 |
|
23% |
18% |
23% |
|
Health Care |
25.3 |
26.3 |
26.1 |
|
26 |
64 |
149 |
|
6% |
10% |
6% |
|
Industrials |
19.1 |
18.6 |
18.0 |
|
86 |
75 |
368 |
|
19% |
12% |
15% |
|
Information Technology |
24.7 |
20.5 |
18.3 |
|
17 |
86 |
217 |
|
4% |
14% |
9% |
|
Materials |
20.1 |
18.1 |
16.4 |
|
42 |
34 |
230 |
|
9% |
5% |
9% |
|
Telecommunication Services |
15.2 |
24.4 |
15.1 |
|
22 |
9 |
90 |
|
5% |
1% |
4% |
|
Utilities |
12.7 |
18.7 |
13.6 |
|
22 |
33 |
130 |
|
5% |
5% |
5% |
|
All |
16.4 |
19.5 |
15.9 |
|
454 |
620 |
2443 |
|
100% |
100% |
100% |
Source: Columbia Management Investment Advisers, LLC
In only a few areas does there appear to be much disparity. The biggest driver of aggregate differences is financials, almost 25% of the European index (vs. 18% in the U.S.), where at first glance, the U.S. names appear to be garnering a high premium. Again, digging slightly deeper, one finds that the disparity is also a function of sector composition. U.S. financials include a growing percentage of REITs, which are very high P/E names (not really the appropriate way to value them). Segmenting the sector ex-real estate makes the distinctions clearer and shrinks the differences considerably when one compares banks to banks, insurance to insurance, etc.

Source: Columbia Management Investment Advisers, LLC
One can examine many other factors to compare issues such as “core” Europe to U.S. as opposed to the peripheral names (Portuguese banks, Greek utilities, etc.) , but hopefully the broad point is clear. One can draw some very misleading conclusions about any disparate group by only looking at the aggregates. The real inefficiencies are far more likely to be down several less-examined levels. In our view, those who draw broad conclusions may be creating opportunities for those who can dig deeper for them. Those sorts of opportunities exist across the world.
Finally, I read this data as ongoing evidence that when discounted for index composition, U.S. equities are not trading at a significant premium to Europe on their current trajectories of EPS. The debate regarding cyclically-adjusted valuation ratios (such as the Shiller CAPE), is worthy of another discussion (the U.S. appears more expensive on these 10-yr rolling metrics based on recent superior margin performance that some observers see reverting). I am less concerned on that front in the intermediate term, but again, to properly research the question requires digging below the surface to understand the fundamentals beyond the superficial averages.
Disclosure
The views expressed are as of 12/1/14, may change as market or other conditions change, and may differ from views expressed by other Columbia Management Investment Advisers, LLC (CMIA) associates or affiliates. Actual investments or investment decisions made by CMIA and its affiliates, whether for its own account or on behalf of clients, will not necessarily reflect the views expressed. This information is not intended to provide investment advice and does not account for individual investor circumstances. Investment decisions should always be made based on an investor's specific financial needs, objectives, goals, time horizon, and risk tolerance. Asset classes described may not be suitable for all investors. Past performance does not guarantee future results and no forecast should be considered a guarantee either. Since economic and market conditions change frequently, there can be no assurance that the trends described here will continue or that the forecasts are accurate.
This material may contain certain statements that may be deemed forward-looking. Please note that any such statements are not guarantees of any future performance and actual results or developments may differ materially from those discussed. There is no guarantee that investment objectives will be achieved or that any particular investment will be profitable.
Investment products are not federally or FDIC-insured, are not deposits or obligations of, or guaranteed by any financial institution, and involve investment risks including possible loss of principal and fluctuation in value.
Securities products offered through Columbia Management Investment Distributors, Inc., member FINRA. Advisory services provided by Columbia Management Investment Advisers, LLC.
© 2014 Columbia Management Investment Distributors, Inc. All rights reserved.
1068969


