Imagine this scenario. Your friend is moving from Indonesia to your hometown of Chicago, and he asks you about buying a new wardrobe suitable for the local climate. You advise him to build his wardrobe around Chicago’s average temperature of 55 degrees, so he stocks up on long pants, light sweaters, long-sleeved shirts and a lightweight jacket. After the move, he discovers he doesn’t have appropriate attire for either a frigid, snowy 10-degree day in early January or a sticky, humid 80-degree day in mid-August. Preparing for the average temperature has left him unprepared for Chicago’s considerable annual fluctuation in temperature, typically ranging from 83° to 7° ― and that’s without factoring in the city’s storied wind.
This scenario seems ridiculous because no one builds a wardrobe around the average temperature. You stock your closet with a variety of seasonal clothes suitable for the range of temperatures where you live. And yet, investors sometimes apply a similar flawed “strategy of averages” that can leave their portfolios unprepared to weather market fluctuations.
Average annual returns offer only partial picture
When investors build their portfolio allocations, they correctly look at long-term average returns for the asset classes they’re considering, such as stocks, bonds, real estate, cash and alternatives. After looking at the returns for asset classes below, though, an investor may be tempted to invest everything in emerging market securities and real estate investment trusts (REITs), as they have the highest average annual returns over the last 10 years.
Equities and REITS Outperformed Over Last Decade
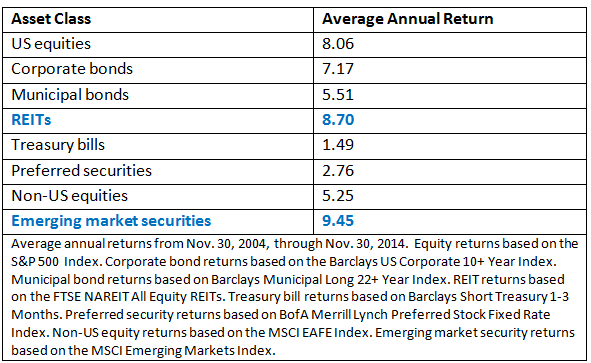
But that would be a mistake because markets are like Chicago’s weather — producing a wide range of highs and lows over long periods of time, but rarely staying at the “average.” In some years, other asset classes outperform the long-term top performers.
Outfitting a portfolio for all seasons
What do investors need to make more “all weather” investment decisions? More information than simply average annual returns. The tools in the chart below enable investors to look beyond returns to better evaluate the characteristics of various asset classes.
Statistical Tools Help Investors Evaluate Asset Classes
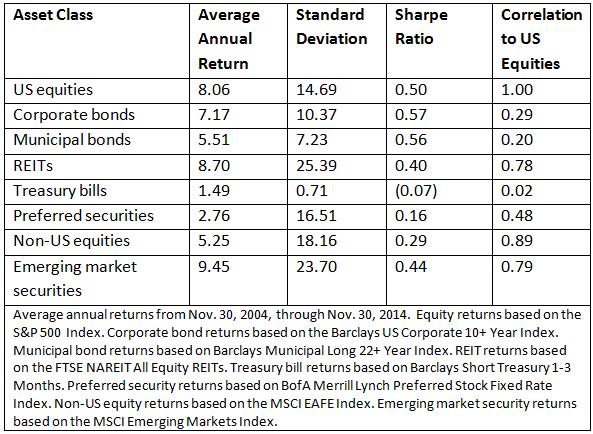
• Standard deviation gauges the expected volatility of an investment — typically, the higher the standard deviation, the more volatile the investment.
• The Sharpe ratio measures the return of an asset class, taking into account its risk (standard deviation). The greater the Sharpe ratio, the better risk-adjusted performance has been.
• Correlation measures how investments move in relationship to each other. A negative or low correlation between two asset classes means that they move independently from each other in reaction to market events, which can help mitigate portfolio losses if one asset class loses value.
So do emerging market securities and REITs still look as appealing as they in the first chart? They have the highest returns, but also the highest volatility. Their risk-adjusted performance is in the middle of the pack, and their diversification benefits will vary depending on your other holdings.
So, in short, their suitability depends on you – your age, risk tolerance, income and liquidity needs, other assets and liabilities, time horizon and goals should be factored in when evaluating investments.
As we enter 2015, consider reviewing your portfolio with your financial advisor to make sure it’s prepared to weather changes in the market with a range of investments that suit your needs.
Important information
The S&P 500 Index is an unmanaged index is considered representative of the US stock market. The Barclays US Corporate 10+ Year Index measures the investment return of US dollar-denominated, investment-grade, fixed-rate, taxable securities with maturities greater than 10 years issued by industrial, utility and financial companies. The Barclays Municipal Long Bond (22+ Year) Index is a total return benchmark designed for long-term municipal assets. The FTSE NAREIT All Equity REITs Index is an unmanaged index considered representative of US REITs. The Barclays Short Treasury 1-3 Months Index includes all publicly issued zero-coupon US Treasury bills that have a remaining maturity of less than three months and more than one month, are rated investment grade and have $250 million or more of outstanding face value. The BofA Merrill Lynch Preferred Stock Fixed Rate Index tracks the performance of fixed-rate US dollar-denominated preferred securities issued in the US domestic market. The MSCI EAFE Index is an unmanaged index considered representative of stocks of Europe, Australasia and the Far East. The MSCI Emerging Markets Index is an unmanaged index considered representative of stocks of developing countries.
The information provided is for educational purposes only and does not constitute a recommendation of the suitability of any investment strategy for a particular investor. Invesco does not provide tax advice. The tax information contained herein is general and is not exhaustive by nature. Federal and state tax laws are complex and constantly changing. Investors should always consult their own legal or tax professional for information concerning their individual situation. The opinions expressed are those of the authors, are based on current market conditions and are subject to change without notice. These opinions may differ from those of other Invesco investment professionals.

Before investing, investors should carefully read the prospectus and consider the investment objectives, risks, charges and expenses.
All data provided by Invesco unless otherwise noted.
Invesco Distributors, Inc. is the US distributor for Invesco Ltd.’s retail products and collective trust funds. Invesco Advisers, Inc. and other affiliated investment advisers mentioned provide investment advisory services and do not sell securities. Invesco Unit Investment Trusts are distributed by the sponsor, Invesco Capital Markets, Inc., and broker-dealers including Invesco Distributors, Inc. PowerShares® is a registered trademark of Invesco PowerShares Capital Management LLC (Invesco PowerShares). Each entity is an indirect, wholly owned subsidiary of Invesco Ltd.
©2015 Invesco Ltd. All rights reserved.