Executive Summary
- It’s a buyer’s market for companies that are producing above average cash flows with limited debt
- We believe enterprise value/sales (EV/S) is an appropriate measure of quality because it takes into account the role of debt in generating sales
- Companies with the strongest balance sheets have largely been unloved this year
One of several unique aspects of the current bull market has been investors’ periodic indifference toward the quality of companies they own as measured by either balance sheet strength or free cash flow.
While the trend looked to be reversing in late 2014, it resumed during the first portion of this year. As the chart below shows, the weighted median EV/S of the top 20% of names in the Russell 2000® Index as ranked by free cash flow (FCF) is notably lower than that of the lowest 20% of cash flow producers. The upshot is that it’s a buyer’s market for companies that are producing above average cash flows with limited debt.
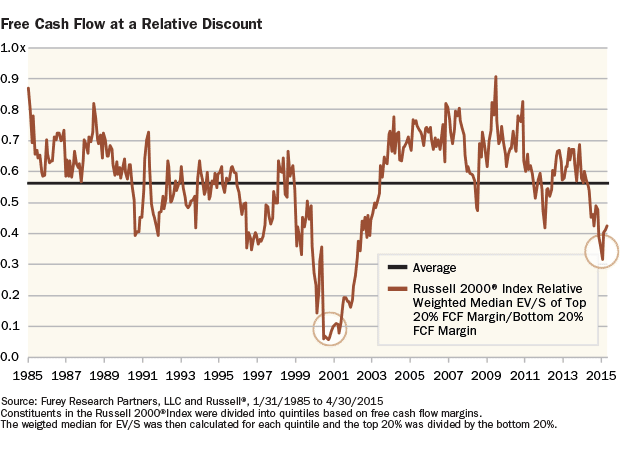
We believe EV/S is an appropriate measure of quality because it takes into account the role of debt in generating sales. Price–to–sales does not specifically include borrowing and therefore doesn’t reflect leverage used to boost income. We view revenue generated through debt as being more at risk from outside factors.
Similarly, companies with the strongest balance sheets have largely been unloved this year. When ranked on debt–to–capital, companies in the bottom quintile of leverage—those with the strongest balance sheets—have fared the worst in the Russell 2000® Value Index year–to–date through the end of April with a return of -1.57%. Businesses in the top quintile of debt–to–capital ratios are the only group that generated positive returns in the Index with a 0.35% return.
The market’s apathy toward quality has been challenging for investors who pursue a margin of safety by owning stocks with strong balance sheets and that generate sales with little leverage. But, it also allows investors a rare opportunity to upgrade the quality of their holdings at attractive valuations. We believe that as the economic expansion continues to age, the broader markets will once again look to high quality companies to help provide protection in an environment believed to have more downside risk.
Disclosure:
Past performance does not guarantee future results.
Economic predictions are based on estimates and are subject to change.
The statements and opinions expressed in this article are those of the author(s). Any discussion of investments and investment strategies represents the presenters’ views as of this date created and are subject to change without notice. The opinions expressed are for general information only and are not intended to provide specific advice or recommendations for any individual. Any forecasts may not prove to be true.
Economic predictions are based on estimates and are subject to change.
There is no guarantee that a particular investment strategy will be successful.
Definitions: Enterprise Value/Sales Ratio: is a financial indicator used to determine the value of a company including debt. It is equal to a company’s Enterprise Value divided by its annual sales. Free Cash Flow: is the amount of cash a company has after expenses, debt service, capital expenditures, and dividends. The higher the free cash flow, the stronger the company’s balance sheet. Price/Cash Flow: represents the amount an investor is willing to pay for a dollar generated from a particular company’s operations. It shows the ability of a business to generate cash and acts as a gauge of liquidity and solvency. Price/Sales Ratio: is calculated by dividing a stock's current price by its revenue per share for the trailing 12 months. Total Debt/Total Capital Ratio of a stock is calculated by dividing the short- and long-term debt obligations of the company by its total capital, which is represented by the company’s debt and shareholders’ equity, which includes common stock, preferred stock, minority interest and net debt. Russell 2000® Index includes the 2000 firms from the Russell 3000® Index with the smallest market capitalizations. All indices are unmanaged. It is not possible to invest directly in an index.
CFA is a trademark owned by the CFA Institute.
©2015 Heartland Advisors
2015201


