Interest rates have been on the march since late January, thanks largely to global rate markets and a looming US Federal Reserve. In general, bonds are vulnerable to falling market prices as a result of higher rates, but there are income investments that can be used to take advantage of, rather than fall victim to, rising rates. They’re known as floating rate instruments.
What’s happening with interest rates?
The 10-year US Treasury yield rose 0.68% from Jan. 30 through May 11.1 Two key variables are combining to push rates higher:
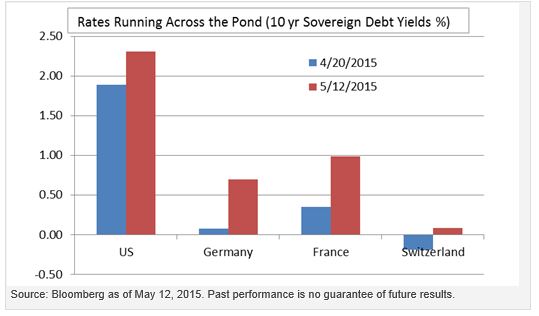
1. Global relative value – Last year, interest rates in Europe crashed toward — and in some cases through — zero. This came largely as a result of the European Central Bank (ECB) embarking on its version of quantitative easing. Very low rates around the world made US Treasuries look cheap by comparison, and created an anchor on how far US rates might rise. But that anchor has become dislodged.
In recent weeks we have seen rates across Europe spike, as seen in the chart below. There are no clear indications (at least to this writer) as to why we have seen the sudden about face in Europe. My best guess: a slightly positive turn for economic optimism in Europe has the very crowded “Follow QE, go long euro debt” trade spooked. We may be seeing the unintended consequences that unprecedented central bank policy may have on rate volatility.
2. The Fed – Ever since the Fed drove the federal funds interest rate to near zero, the looming question has been, “Will next year finally be the year that the Fed raises rates?” In 2015, that question changed slightly but crucially to, “Will this year finally be the year that the Fed raises rates?” With expected liftoff this year, markets are more responsive (i.e., volatile) to every economic release—and investors are carefully parsing every statement from Fed Chair Janet Yellen.
Enter floating rate instruments
When rates rise, bond prices fall. The math behind this basic bond equation is premised upon a security’s fixed coupon payment. However, with a floating rate instrument, coupons are not fixed — they rise and fall based on an underlying benchmark, typically resetting every three months based on 90-day Libor. As a result, two things happen.
- Income and cash flow can rise as interest rates are rising (and fall if rates are declining). This can help preserve investor purchasing power if higher rates are accompanying rising inflation expectations.
- Prices for floating rate instruments tend to be more stable. Since cash flows are only “locked” until the coupon’s next reset date, price volatility as a result of interest rate changes can be a fraction of what is experienced with fixed rate investments.
Two floating rate ideas for today’s market
1. Senior loans – Senior loans, also known as bank loans, are generally structured with floating rate coupons based on a spread over 90-day Libor. As such, interest rate risk tends to be measured by the number of days until the next rate reset, rather than the more traditional measure of duration used for fixed rate investments. Investors who are looking for exposure to high yield bonds but are concerned about rates might prefer senior loans — most senior loans are to issuers rated below investment grade, yet these instruments have very low interest rate exposure.
|
As of March 31, 2015 |
Yield to Maturity |
Duration |
Days to Reset |
|
BofA Merrill Lynch US High Yield Index |
6.45% |
4.05 |
NA |
|
S&P/LSTA Leveraged Loan 100 Index |
4.76% |
NA |
0-90 |
Sources: Merrill Lynch, Bloomberg, S&P/LSTA. An investment cannot be made directly into an index. Past performance is no guarantee of future results.
- Floating rate or “fixed to float” preferred securities – Investors have flocked to preferred securities in pursuit of higher income, but may not be aware of the significant rate risk imbedded in fixed rate preferreds. But not all preferreds are built alike. Floating rate preferred securities (or “floaters”) have coupons that reset periodically, typically based on a spread over 90-day Libor. “Fixed to float” preferred securities carry a fixed coupon for a set period of time (typically between five and 10 years), then convert to a variable rate structure. Interest rate risk is measured based on the amount of time until the next rate reset. As such, floaters have very low rate exposure. Meanwhile, fixed to float preferreds should experience measurable but diminishing volatility as a result of rate fluctuations during the fixed rate period of their life cycles. Both floaters and fixed to floating rate structures tend to offer lower rate risk than fixed preferreds:
|
As of March 31, 2015 |
Yield to Worst |
Duration |
|
BofA Merrill Lynch Core Plus Fixed Rate Preferred Securities Index |
4.37% |
6.52 |
|
BofA Merrill Lynch Adjustable Rate Preferred Securities Index |
4.50% |
0.16 |
|
Wells Fargo Hybrid and Preferred Securities Floating and Variable Rate Index |
4.19% |
3.08 |
Sources: BofA Merrill, Wells Fargo. An investment cannot be made directly into an index. Past performance is no guarantee of future results.
Performance amid the recent rate rise
The value of the floating rate structure has come to light in the recent rising rate environment:
|
Index Returns from Jan. 31, 2015, through May 11, 2015 |
|
|
Barclays U.S. Aggregate Bond Index |
-1.79% |
|
S&P/LSTA Leveraged Loan 100 Index |
2.48% |
|
Wells Fargo Hybrid and Preferred Securities Floating and Variable Rate Index |
1.75% |
Source: Bloomberg L.P. An investment cannot be made directly into an index. Past performance is no guarantee of future results.
Conclusion
The rate path remains far from clear, but recent upward pressure on yields may have investors looking to decrease their interest rate exposure. Floating rate structures offer investors the opportunity to participate in, rather than fall victim to, a rising rate environment.
1 Source: Bloomberg as of May 12, 2015
Important information
The S&P/LSTA U.S. Leveraged Loan 100 Index is representative of the performance of the largest facilities in the leveraged loan market.
The BofA Merrill Lynch US High Yield Index tracks the performance of US dollar-denominated, below-investment-grade corporate debt publicly issued in the US domestic market.
The Barclays U.S. Aggregate Bond Index is an unmanaged index considered representative of the US investment-grade, fixed-rate bond market.
The Wells Fargo® Hybrid and Preferred Securities Floating and Variable Rate Index is a market capitalization-weighted index designed to track the performance of preferred stock, as well as certain types of “hybrid securities” that are functionally equivalent to preferred stocks, that are issued by US-based or foreign issuers and that pay a floating or variable rate dividend or coupon.
The BofA Merrill Lynch Core Plus Fixed Rate Preferred Securities Index tracks the performance of fixed rate, US dollar-denominated preferred securities issued in the US domestic market. Securities must be rated at least B3 (based on an average of three leading ratings agencies: Moody’s, S&P and Fitch) and must have an investment-grade country risk profile (based on an average of Moody’s, S&P and Fitch foreign currency long-term sovereign debt ratings.
The BofA Merrill Lynch Adjustable Rate Preferred Securities Index tracks the performance of US dollar-denominated, investment-grade, floating rate preferred securities publicly issued in the US domestic market. Qualifying securities must have an investment-grade rating (based on an average of Moody’s, S&P and Fitch) and must have an investment-grade-rated country of risk (based on an average of Moody’s, S&P and Fitch foreign currency long term sovereign debt ratings).
Libor, or the London Interbank Offered Rate, is a benchmark rate that some of the world’s leading banks charge each other for short-term loans.
Interest rate spread is the difference between the average yield a financial institution receives from loans and the average rate it pays on deposits and borrowings.
Relative value refers to the value of one investment relative to another.
Floating rates are interest rates that are allowed to move up and down with the rest of the market or along with an index.
Duration is a measure of the sensitivity of the price of a fixed income investment to interest rate changes.
Yield-to-maturity is the rate of return anticipated on a bond if held until the end of its lifetime.
Yield-to-worst is the lowest possible yield that an investor can receive on a bond.
Diversification does not guarantee a profit or eliminate the risk of loss.
There is a risk that the value of the collateral required on investments in senior secured floating rate loans and debt securities may not be sufficient to cover the amount owed, may be found invalid, may be used to pay other outstanding obligations of the borrower or may be difficult to liquidate.
Junk bonds involve a greater risk of default or price changes due to changes in the issuer’s credit quality. The values of junk bonds fluctuate more than those of high quality bonds and can decline significantly over short time periods.
There are risks involved with investing in ETFs, including possible loss of money. Shares are not actively managed and are subject to risks similar to those of stocks, including those regarding short selling and margin maintenance requirements. Ordinary brokerage commissions apply. The fund’s return may not match the return of the underlying index. Please see the current prospectus for more information regarding the risk associated with an investment in the fund.
Most senior loans are made to corporations with below investment-grade credit ratings and are subject to significant credit, valuation and liquidity risk. The value of the collateral securing a loan may not be sufficient to cover the amount owed, may be found invalid or may be used to pay other outstanding obligations of the borrower under applicable law. There is also the risk that the collateral may be difficult to liquidate, or that a majority of the collateral may be illiquid.
Variable- and floating-rate securities may be subject to liquidity risk, there may be limitations on the fund’s ability to sell securities. Due to the features of these securities, there can be no guarantee they will pay a certain level of a dividend and such securities will pay lower levels of income in falling interest rate environment.
The information provided is for educational purposes only and does not constitute a recommendation of the suitability of any investment strategy for a particular investor. Invesco does not provide tax advice. The tax information contained herein is general and is not exhaustive by nature. Federal and state tax laws are complex and constantly changing. Investors should always consult their own legal or tax professional for information concerning their individual situation. The opinions expressed are those of the authors, are based on current market conditions and are subject to change without notice. These opinions may differ from those of other Invesco investment professionals.
All data provided by Invesco unless otherwise noted.
Invesco Distributors, Inc. is the US distributor for Invesco Ltd.’s retail products and collective trust funds. Invesco Advisers, Inc. and other affiliated investment advisers mentioned provide investment advisory services and do not sell securities. Invesco Unit Investment Trusts are distributed by the sponsor, Invesco Capital Markets, Inc., and broker-dealers including Invesco Distributors, Inc. PowerShares® is a registered trademark of Invesco PowerShares Capital Management LLC (Invesco PowerShares). Each entity is an indirect, wholly owned subsidiary of Invesco Ltd.
©2015 Invesco Ltd. All rights reserved.


