Bonds: Can’t Live With Them, but How Do You Live Without Them?
Bonds: Can’t live with them, but how do you live without them?
Quick look
- We find today’s bond market exhibits more risk and less reward than in past decades.
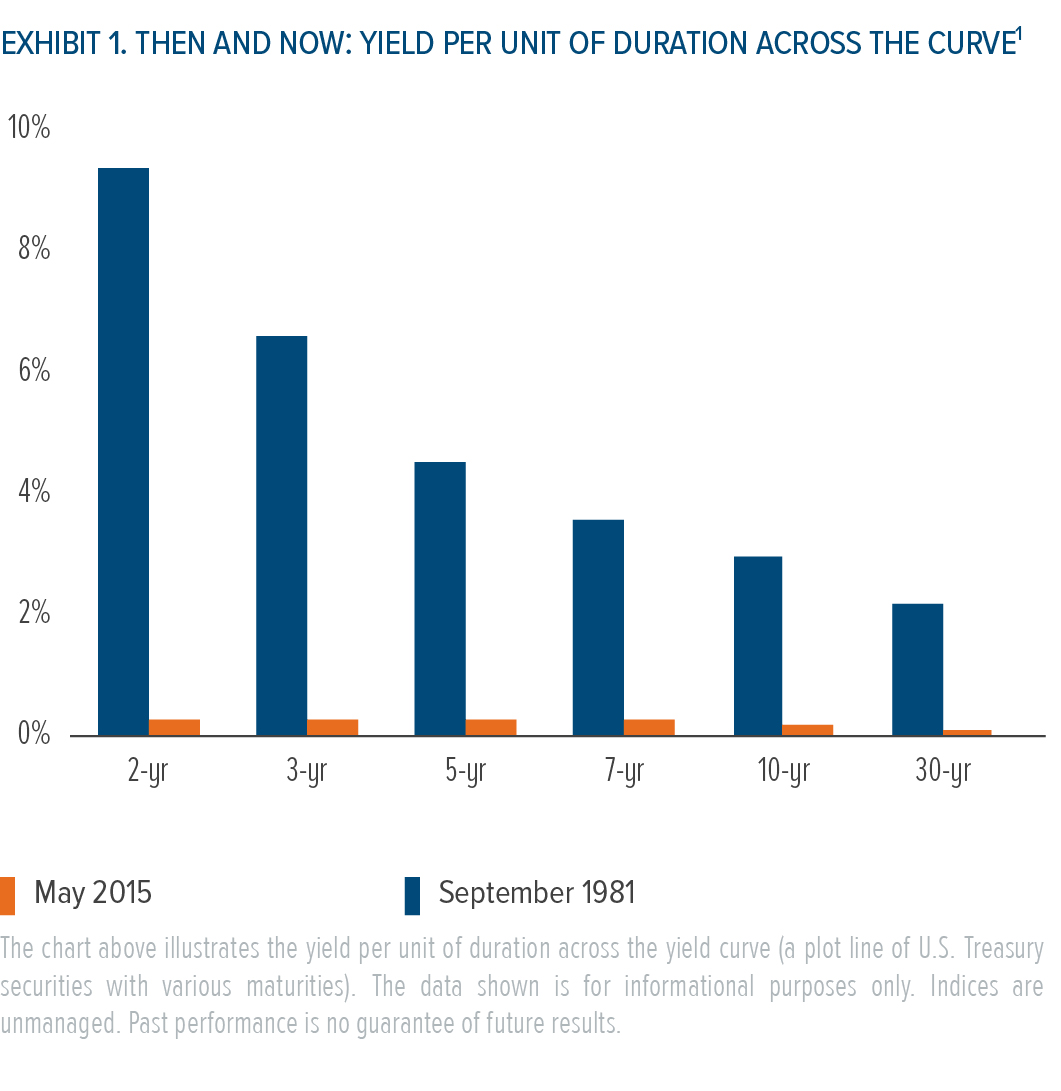
- In the early 1980s, the 10-year Treasury bond offered nearly eight times the yield it does today with less than two-thirds of today’s sensitivity to interest rates.1
- The annualized total return of the Barclays US Treasury Bellwethers 10-year Index from September 1981 through May 2015 was 8.5%.1
- Today’s low starting yields will make it difficult for bond investors to earn the same returns they did in past decades.
Then and now
For generations of investors, conventional wisdom regarding managing portfolio risk relied on the cardinal rule of diversification. In its simplest form, this meant holding high quality bonds in an attempt to generate income, and offset volatility and drawdowns in the stock market.
This approach served investors reasonably well for many years. During the decades leading up to the financial crisis, bonds offered a valuable means of investment diversification and returns, as historically high interest rates moved gradually lower.
Today, the risk/reward profile of the bond market looks dramatically different. Bond yields are at historic lows, while duration (or interest-rate risk) is significantly higher.1
10-YEAR TREASURY YIELD TO MATURITY
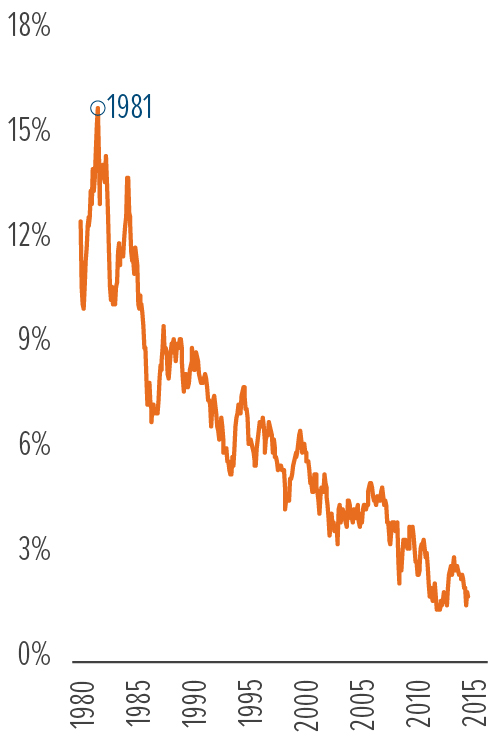
The chart above illustrates the historical yield to maturity of a 10-year U.S. Treasury Bond and is shown for informational purposes only. Past performance is no guarantee of future results.
So what are the implications for investors? As indicated in Exhibit 2, bond market yields have generally been predictive of bond market returns. Given today’s low yields, this is not good news for bond investors.
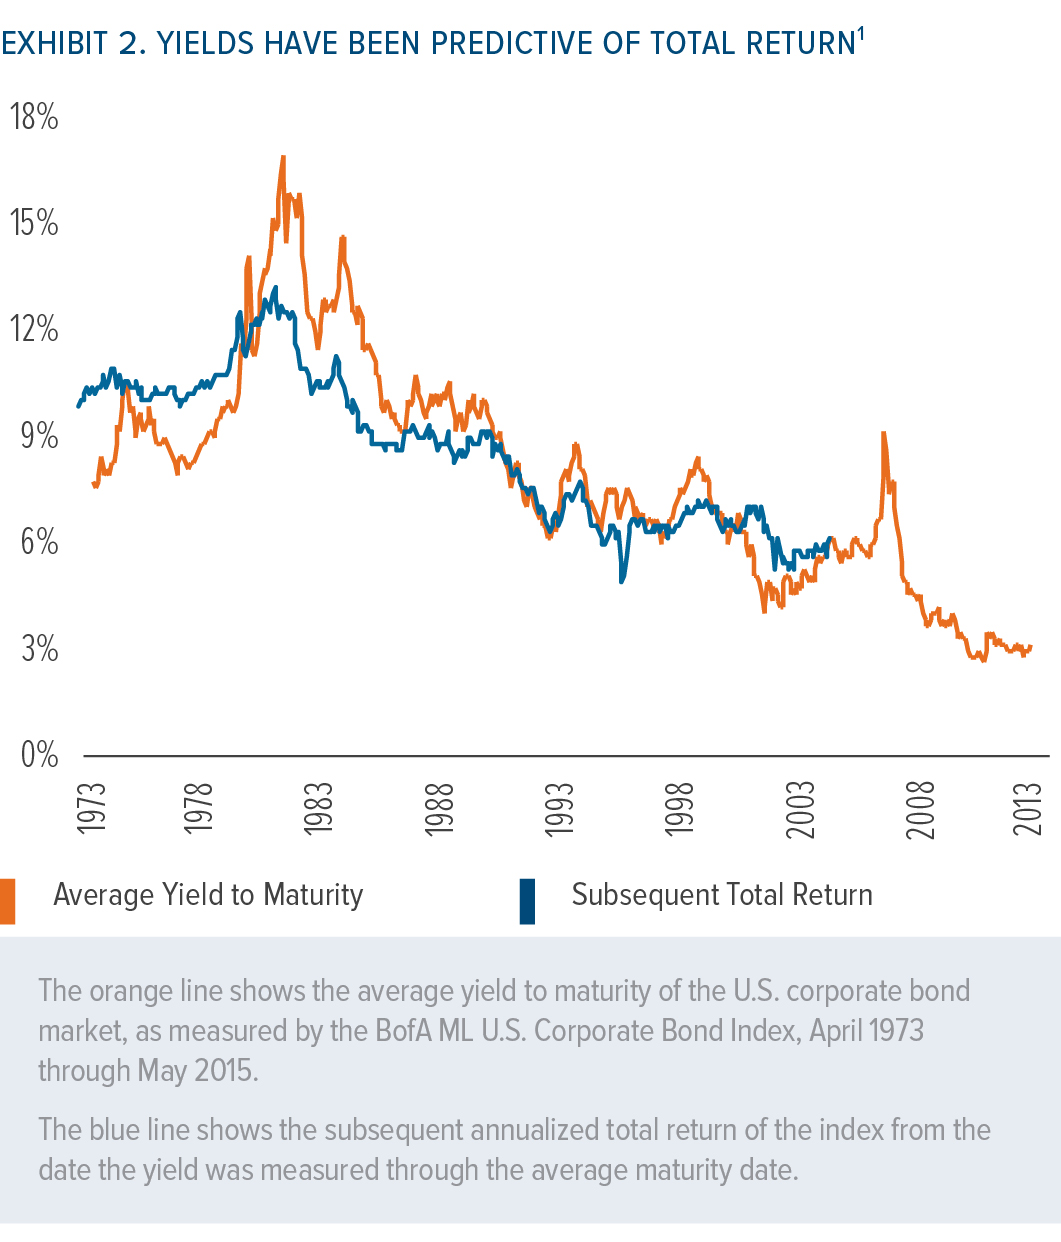
To put this into context, consider the 8.5% annualized return that the 10-year Treasury bond has generated since September 1981. In order for a newly issued 2.0% 10-year Treasury bond to generate 8.5% over the next five years, its yield to maturity would have to fall from 2.0% to -5.2%.1
Negative yields are certainly possible, as seen recently throughout Europe. However, the likelihood of U.S. yields falling more than 7% seems low. In fact, interest rates seem more likely to move higher than lower. During the 10 years prior to the financial crisis, the yield on the 10-year Treasury averaged 4.8%. Since the end of 2008 it’s averaged just 2.6%.
With bonds now offering a much poorer risk/reward profile than in decades past, their appeal and usefulness as a risk diversifier is greatly diminished.
So where do advisors go from here?
The challenge of generating reliable income in a low-rate environment is causing many advisors to rethink traditional planning techniques (e.g., static stock/bond allocation). This includes using risk management tools that may not have been available when traditional planning methods were developed.
One such tool is the use of a risk management overlay on the equity markets in an effort to stabilize volatility and reduce downside risk. Similar risk management techniques have been used by major financial institutions to develop cost-effective safeguards in an effort to weather volatile markets.
This approach has created a new category within the investment industry referred to as “managed risk equities.”
Managed risk equity strategies often seek to stabilize the short-term volatility of a portfolio around a target level (e.g., 12% standard deviation), and reduce the downside exposure of a portfolio during periods of significant and sustained market decline. The managed risk fund space recently surpassed $260 billion in assets through various mutual funds, exchange-traded funds, collective investment trusts, target-date funds, and variable annuities.2
About Milliman Financial Risk Management LLC
Milliman Financial Risk Management LLC is a global leader in financial risk management to the retirement savings industry. Milliman FRM provides investment advisory, hedging, and consulting services on $184 billion in global assets (as of March 31, 2015). Established in 1998, the practice includes over 130 professionals operating from three trading platforms around the world (Chicago, London, and Sydney). Milliman FRM is a subsidiary of Milliman, Inc.
Milliman, Inc. (Milliman) is one of the world’s largest independent actuarial and consulting firms. Founded in Seattle in 1947, Milliman has 55 offices in key locations worldwide that are home to over 2,600 professionals, including more than 1,300 qualified consultants and actuaries.
Important Disclosures
The information, products, or services described or referenced herein are intended to be for informational purposes only. This material is not intended to be a recommendation, offer, solicitation or advertisement to buy or sell any securities, securities related product or service, or investment strategy, nor is it intended to be to be relied upon as a forecast, research or investment advice.
The products or services described or referenced herein may not be suitable or appropriate for the recipient. Many of the products and services described or referenced herein involve significant risks, and the recipient should not make any decision or enter into any transaction unless the recipient has fully understood all such risks and has independently determined that such decisions or transactions are appropriate for the recipient. Investment involves risks. Any discussion of risks contained herein with respect to any product or service should not be considered to be a disclosure of all risks or a complete discussion of the risks involved. Investing in foreign securities is subject to greater risks including: currency fluctuation, economic conditions, and different governmental and accounting standards. There are risks associated with futures contracts. Futures contract positions may not provide an effective hedge because changes in futures contract prices may not track those of the securities they are intended to hedge. Futures create leverage, which can magnify the potential for gain or loss and, therefore, amplify the effects of market, which can significantly impact performance. There are also risks associated with investing in fixed income securities, including interest rate risk, and credit risk.
The recipient should not construe any of the material contained herein as investment, hedging, trading, legal, regulatory, tax, accounting or other advice. The recipient should not act on any information in this document without consulting its investment, hedging, trading, legal, regulatory, tax, accounting and other advisors. Information herein has been obtained from sources we believe to be reliable but neither Milliman Financial Risk Management LLC (“Milliman FRM”) nor its parents, subsidiaries or affiliates warrant its ¬¬completeness or accuracy. No responsibility can be accepted for errors of facts obtained from third parties.
Past performance is not indicative of future results. Index performance information is for illustrative purposes only, does not represent the performance of any actual investment or portfolio, and should not be viewed as a recommendation to buy/sell. It is not possible to invest directly in an index. Any hypothetical, back tested data illustrated herein is for illustrative purposes only, and is not representative of any investment or product. RESULTS BASED ON SIMULATED OR HYPOTHETICAL PERFORMANCE RESULTS HAVE CERTAIN INHERENT LIMITATIONS. UNLIKE THE RESULTS SHOWN IN AN ACTUAL PERFORMANCE RECORD, THESE RESULTS DO NOT REPRESENT ACTUAL TRADING. ALSO, BECAUSE THESE TRADES HAVE NOT ACTUALLY BEEN EXECUTED, THESE RESULTS MAY HAVE UNDER-OR OVER-COMPENSATED FOR THE IMPACT, IF ANY, OF CERTAIN MARKET FACTORS, SUCH AS LACK OF LIQUIDITY. SIMULATED OR HYPOTHETICAL TRADING PROGRAMS IN GENERAL ARE ALSO SUBJECT TO THE FACT THAT THEY ARE DESIGNED WITH THE BENEFIT OF HINDSIGHT. NO REPRESENTATION IS BEING MADE THAT ANY ACCOUNT WILL OR IS LIKELY TO ACHIEVE PROFITS OR LOSSES SIMILAR TO THESE BEING SHOWN.
For any hypothetical simulations illustrated, Milliman FRM does not manage, control or influence the investment decisions in the underlying account. The underlying accounts in hypothetical simulations use historically reported returns of widely known indices. In certain cases where live index history is unavailable, the index methodology provided by the index may be used to extend return history. To the extent the index providers have included fees and expenses in their returns, this information will be reflected in the hypothetical performance. Milliman FRM does not intend the use of such indices to be construed as investment advice or a recommendation to invest in similar accounts.
The materials in this document represent the opinion of the authors at the time of authorship; they may change, and are not representative of the views of Milliman FRM or its parents, subsidiaries, or affiliates. Milliman FRM does not certify the information, nor does it guarantee the accuracy and completeness of such information. Use of such information is voluntary and should not be relied upon unless an independent review of its accuracy and completeness has been performed. Materials may not be reproduced without the express consent of Milliman FRM. Milliman Financial Risk Management LLC is an SEC-registered investment advisor and subsidiary of Milliman, Inc.
Footnote:
1 Bloomberg LP, as of May 31, 2015
2 Milliman Financial Risk Management LLC, 2015
© Milliman Financial Risk Management LLC


