George Taylor's "Hemline Index Theory" has persisted since 1926, but is it true?
If you search long enough, or mine enough data, you are bound to find correlations that, while statistically robust, have no meaningful explanatory power.
As investors we are confronted with an unending morass of data. With ever-increasing streams of information, cheap computing power, and our desire as humans to construct narratives to explain complex systems, we understandably try to draw conclusions to put our minds at ease or assist in decision-making. The flaw in this approach is that we often fool ourselves into believing false narratives or we develop fervent beliefs based on data that is inherently noisy or far more complex than a superficial analysis reveals.
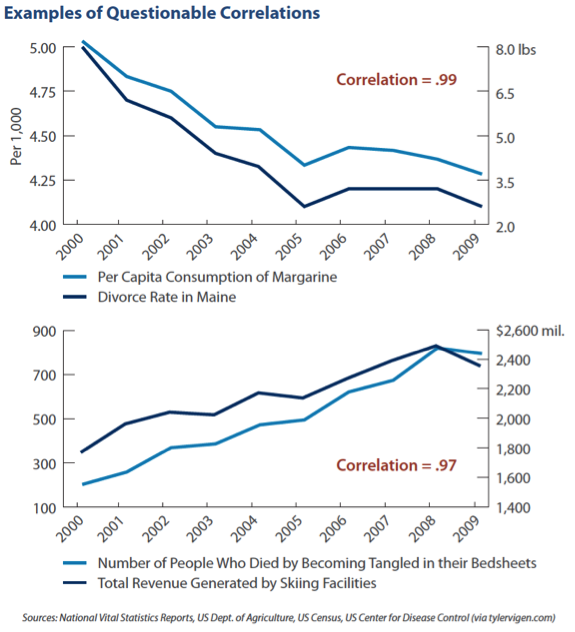
Enter spurious correlation.¹ If you search long enough, or mine enough data, you are bound to find correlations that, while statistically robust, have no meaningful explanatory power. How else can one explain the mysteriously tight .99 correlation between the "Divorce Rate in Maine" with "Per Capita Consumption of Margarine" from 2000 to 2009? Or the .97 correlation between the "Number of People Who Died by Becoming Tangled in Their Bed Sheets" with "Total Revenue Generated by Skiing Facilities" from 2000 to 2009? These questionable examples bring to mind the aphorism "correlation does not imply causation."
Of course, upon a closer look at the underlying data the relationships weaken. When we calculate the correlation of the percentage change in each data series, the correlation declines to .87 for the Divorce Rate in Maine and .57 for Total Revenue Generated by Skiing Facilities. The r-squared — defined as the percentage of variation explained by the statistical model — also drops to .76 and .32, respectively, implying there are numerous other variables that might explain these relationships. While the r-squared for the Divorce Rate in Maine and Per Capita Consumption of Margarine is high, there is no logical reason to prove causality.
If you believe we are cherry-picking nonfinancial correlations, the history of financial market participants finding, and at times believing, dubious correlations is equally bizarre. For instance, economist George Taylor introduced the "Hemline Index Theory" in 1926, which posited that the hemlines on women’s dresses fluctuate with the economy. An academic paper published in 2010 by the Erasmus School of Economics found that the direction of hemline length lagged the direction of the economy by three years. While the paper’s conclusion is that hemline length correlates with the economy, the number of so-called "latent variables" that might have more explanatory power is staggering.
Another example is the life and times of Dr. Copper — the only commodity commonly known to have a Ph.D. in economics.² Due to copper’s role in various manufacturing and construction activities it is seen as a reasonable barometer for overall economic health. When the price of copper drops precipitously, some market participants tend to get spooked, leading to hyperbolic headlines that insinuate an imminent economic collapse.
The problem with this line of reasoning is that many variables drive the price of copper. Dwindling copper demand may presage an economic downturn, but it completely ignores the other variable — supply — that plays a large part in the price equation. If investors believe that a copper price decline will lead to a declining economy and, thus, lower investment returns, they may trade hyperactively, which strays from their long-term goals and ultimately ends up hurting their performance. One example is the spectacular collapse of copper between July 29 and September 30, 2011, which saw the metal lose 30% of its value. The forward one and three-year price return for the S&P 500 over the same period? 27.2% and 74.1%.
Yes, you might construe this as a form of data mining. However, we caution readers presented with charts and examples such as those we’ve provided in this piece to ask:
- Have the statistical associations between supposedly correlated variables been properly quantified?
- Is there a good economic case or logical reason why the relationship should display correlation and/or explanatory power?
- Has the relationship performed consistently over numerous time periods?
- Have I paid careful attention to any pitfalls or shortcomings in the data?
The examples provided above are obviously egregious offenders as no one thinks that consumption of margarine explains the divorce rate in Maine or that skiing facility revenue causes deaths by tangled bed sheets. Yet, underlying this absurdity lies the more pernicious practice of making strategic or investment decisions based on surface-level diligence and/or drawing conclusions based on statistics that miss key variables — or to steal from former US Secretary of Defense Donald Rumsfeld, "the unknown unknowns."
As long-term, value-oriented investors we make investment decisions based on a multiyear investment horizon. This means that while we constantly assess and reassess our portfolios, we are more acutely focused on the quality and durability of cash flows, competitive positioning, and managerial strength than the endless stream of data that confronts us. To be clear, sometimes there is a signal in the noise. However, constructing an investment process based on the cacophony of market prognostications and focusing excessively on every data point will lose out to an investment process based on fundamentals, market experience, and, as as Leo Tolstoy wrote, “everything comes in time to him who knows how to wait...there is nothing stronger than these two: patience and time, they will do it all.”
Footnotes
¹ Correlation is a numerical measure of the strength of the relationship between two or more variables expressed within a range of -1 (no relationship) to +1 (the two variables move in tandem).
² The exact origin of when financial commentators started using the term "Dr. Copper" is unclear. However, numerous financial press articles talk about copper’s predictive power with regard to equity prices.
Copyright 2015 Saturna Capital Corporation and/or its affiliates. All rights reserved. Vol. 9 · No. 4
Important Disclaimers and Disclosures
This report is intended only for the information of the reader and is not to be used for or considered as an offer or the solicitation of an offer to sell or buy any securities or other financial instruments of any kind, including without limitation, any mutual fund or other product offered, sponsored, created, or managed by Saturna Capital Corporation or its subsidiaries or affiliates ("Saturna"). This report is not intended for distribution to, or use by, any person or entity who is a citizen or resident of, or located in, any locality, state, country, or other jurisdiction in which such distribution, publication, availability, or use would be contrary to law or regulation or which would subject Saturna to any registration or licensing requirement within such jurisdiction.
This document should not be considered as providing investment advice or services, or any other service offered by Saturna. Saturna may not have taken any steps to ensure that the securities referred to in this report are suitable for any particular investor. Saturna will not treat recipients as its customers by virtue of their reading or receiving the report.
Nothing in this report constitutes investment, legal, accounting, or tax advice or a representation that any investment or strategy is suitable or appropriate to a particular investor's circumstances or otherwise constitutes a personal recommendation to any investor. Saturna does not offer advice on the tax consequences of any investment.
All material presented in this report, unless specifically indicated otherwise, is under copyright to Saturna. None of the material, nor its content, nor any copy of it, may be altered in any way, transmitted to, copied, or distributed to any other party without the prior express written permission of Saturna. Unless otherwise indicated, all trademarks, service marks, and logos used in this report are trademarks or service marks of Saturna.
The information in this report was obtained from sources Saturna believes to be reliable, and Saturna believes the information and opinions in the material are accurate and complete as of the date of this material. However, information and opinions contained herein will change over time and without notice. Saturna has no obligation to update or amend any information or opinions at any time. Saturna makes no representations as to the accuracy or completeness of this material, nor does it have any responsibility to ensure that any other materials, including any containing materially different information, are brought to the attention of any recipient of this report.
Under no circumstances shall Saturna, its employees, or any affiliate be responsible for any investment decision by any recipient. This material is distributed on condition that it will not form the sole basis or a sufficient basis for any investment decision by any recipient. Any recipient who is not a market professional or institutional investor should seek the advice of an independent financial adviser prior to making any investment based on this report or for any necessary explanation of its contents.
Saturna does not provide tax, legal, or accounting advice. Investors should consult their own tax, legal, and accounting advisers before engaging in any transaction. In compliance with IRS requirements, recipients are notified that any discussion of US federal tax issues contained or referred to herein is not intended or written to be used for the purpose of (A) avoiding penalties that may be imposed under the Internal Revenue Code; nor (B) promoting, marketing, or recommending to another party any transaction or matter discussed herein.
The Dow Jones Industrial Average is a price-weighted index of 30 of the largest, most widely held US stocks. The S&P 500 is an index comprised of 500 widely held common stocks considered to be representative of the US stock market in general. The Russell 1000 Growth index is a widely recognized index of large-cap growth stocks. The Russell 2000 Index is comprised of US small cap stocks and measures the performance of the 2,000 smallest US companies in the Russell 3000 Index. The NASDAQ Composite index measures the performance of more than 5,000 US and non-US companies traded "over the counter" through the National Association of Securities Dealers Automated Quotation system. The MSCI EAFE Index, produced by Morgan Stanley Capital International, measures the equity market performance of developed markets in Europe, Australasia, and the Far East. The MSCI Emerging Markets Index, produced by Morgan Stanley Capital International, measures equity market performance in over 20 emerging market countries. Barclay's Capital US Aggregate Bond Index measures the performance of the US bond market.
All indices shown are widely recognized, unmanaged indices of common stock and bond prices that reflect no deductions for fees, expenses, or taxes. Investors cannot invest directly in the indices.
Past performance does not imply or guarantee future performance, and no representation or warranty, express or implied, is made regarding future performance. The price for, value of, and income from any of the securities or financial instruments mentioned in this report can fall as well as rise. The value of foreign securities and financial instruments is subject to exchange rate fluctuations that may have a positive or negative effect on the price or income of such securities or financial instruments. Investors in securities such as American Depositary Receipts — the values of which are influenced by currency volatility — effectively assume this risk.